Processing of a large offshore 3DVSP DAS survey in a producing well
Borehole seismic acquisition over fiber-optic cables has gained popularity in recent times. For conventional wireline surveys, it avoids the need for a dedicated VSP run, resulting in significant time and cost-savings.1,2,3 (Borland et al., 2016; Useche et al., 2020; Martinez et al., 2020). It also allows cost-effective recording of large receiver aperture 3DVSPs in fields, where wells are already instrument with optical fiber.4 (Mateeva et al., 2013).
Fiber deployment over tubing, such as the case in the present study, often results in noisier data, due to suboptimal receiver coupling conditions. The noise issue is further exacerbated if data are recorded while wells are under flowing condition. Moreover, fiber deployment in highly deviated wells also causes severe receiver directivity footprint, which needs to be addressed in processing. All these factors impose considerable challenges to processing of the data acquired under such conditions, as the case with the present study.
DATA ACQUISITION
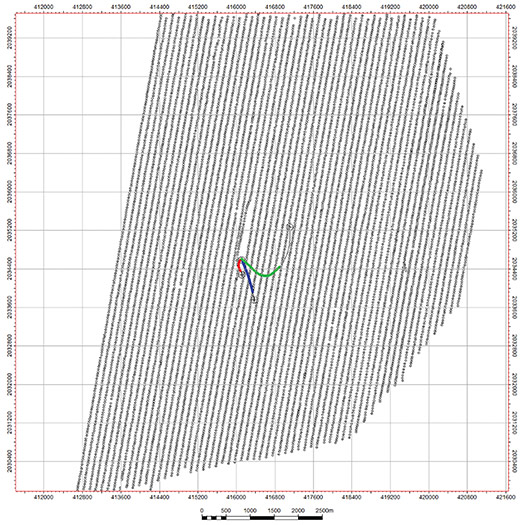
The survey consists of over 10,000 shots recorded by fiber in four wells. The data are acquired in a grid pattern with shot spacing of 50 m and line spacing of 125 m. Figure 1 shows the source and receiver locations. The colored dots are receivers, and empty circles are sources. In the present study, we show the results from a single well with receivers represented by green dots.
Quality of acquired data is quite variable. The well deviation improves fiber coupling, resulting in higher signal-to-noise ratio than observed in vertical wells with similar fiber deployment. Production noise is present on all wells; however, amplitude of this noise varies over time, as well as over receiver depths.
DATA PROCESSING
A comprehensive data processing chain, comprising multi-domain denoise, source designature, predictive deconvolution, receiver directivity compensation, and 4D interpolation, was applied to process the data. Reverse time migration (RTM) was carried out for imaging, and some post- migration conditioning—including receiver directivity correction, dip guided selective stacking, residual alignment, nonlinear stacking, and ray-based illumination compensation—was applied. The breakdown of each processing step is discussed in the following sections.
SHOT DOMAIN PROCESSING
Production-related noise was dominant in lower frequencies (up to 35 Hz) and was spread over a range of velocities in the shot domain. Tau-p and an FX infinite impulse response dip filter were used to remove the very low velocity components of this noise. A tau-p domain denoise was also done to attenuate constant velocity noise by algorithmically identifying and suppressing the anomalous amplitude values in this domain.
A shot-by-shot source signature deconvolution was applied to debubble, deghost and zero-phase the signal. Far-field signature for this operation was computed from the near-field hydrophone for each record.
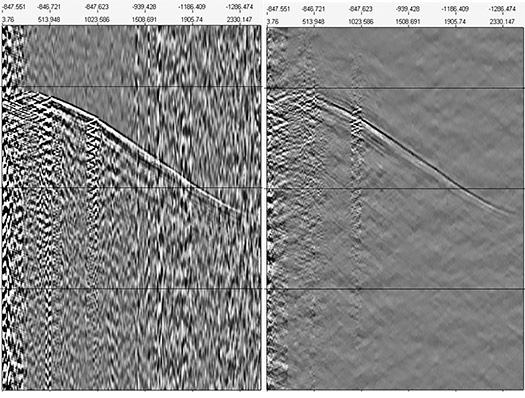
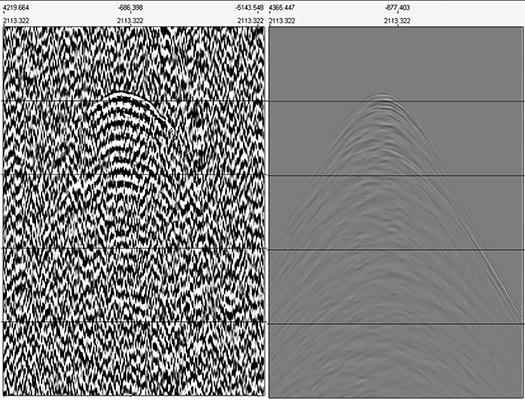
To suppress the repetitive ringing noise, due mainly to coupling conditions, a predictive deconvolution operation was used. Figure 2 compares one such gather after shot domain processing. Downgoing wavefield is also removed in shot domain processing by a Tau-p domain filter.
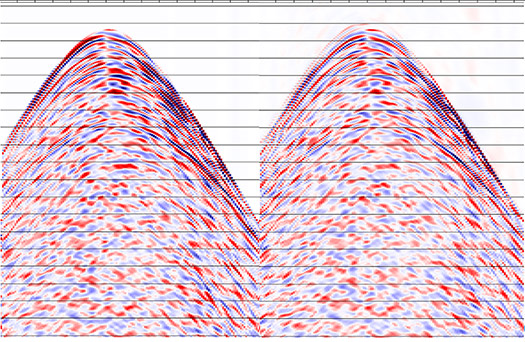
A shot domain scaling by 1/p values was applied in Tau-p domain.5 (Sayed et al., 2020). This step effectively provides amplitude-only DAS to velocity scaling. For example, common receiver gather, before and after scaling, is compared in Fig. 3. It can be seen from this figure that scaling by 1/p improves amplitude balancing on either side of the minimum offset location.
RECEIVER DOMAIN DENOISE AND INTERPOLATION
The data are NMO-corrected by ray tracing through a 1D-velocity function, extracted from an isotropic PSDM velocity model at the wellhead location. The NMO-corrected data are then sorted in receiver domain. When such data are analyzed along or orthogonal to the shooting direction, several parabolic events are identified with their origin at the zero-offset location. A three-dimensional parabolic Radon transform (3D PRT) is used to model these events.
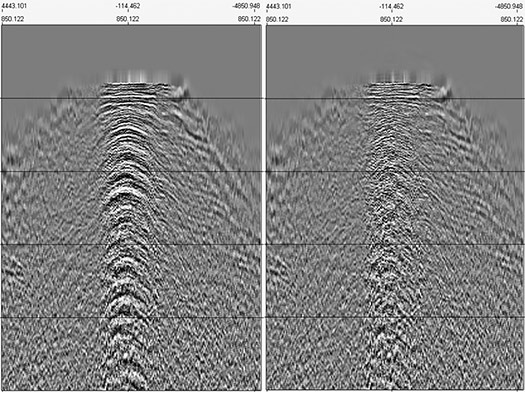
The modeled coherent noise through this process is further isolated by curvelet transform before adaptively subtracting from the data. The parameters for this 3D PRT transform are carefully selected for signal protection and are varied with receiver depth. For example, NMO- corrected common receiver gather from the near-well location line, before and after 3D PRT denoise is shown in Fig. 4.
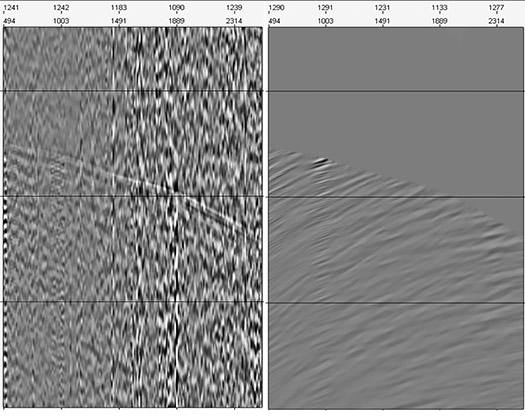
The data after this step are regularized to a 50-m × 50-m grid through a 4D matching pursuit Fourier interpolation (4D MPFI) algorithm. This step further attenuates the production noise that, due to its time-variant nature, remains incoherent in receiver domain. Following this step, NMO correction is removed. Examples of common shot and common receiver gathers of raw and processed data after this step are compared in Figs. 5 and 6, respectively. As a final spectral shaping step, a bandwidth extension algorithm is used to enhance amplitudes, both on lower- and higher-end of input spectra.
REVERSE TIME MIGRATION
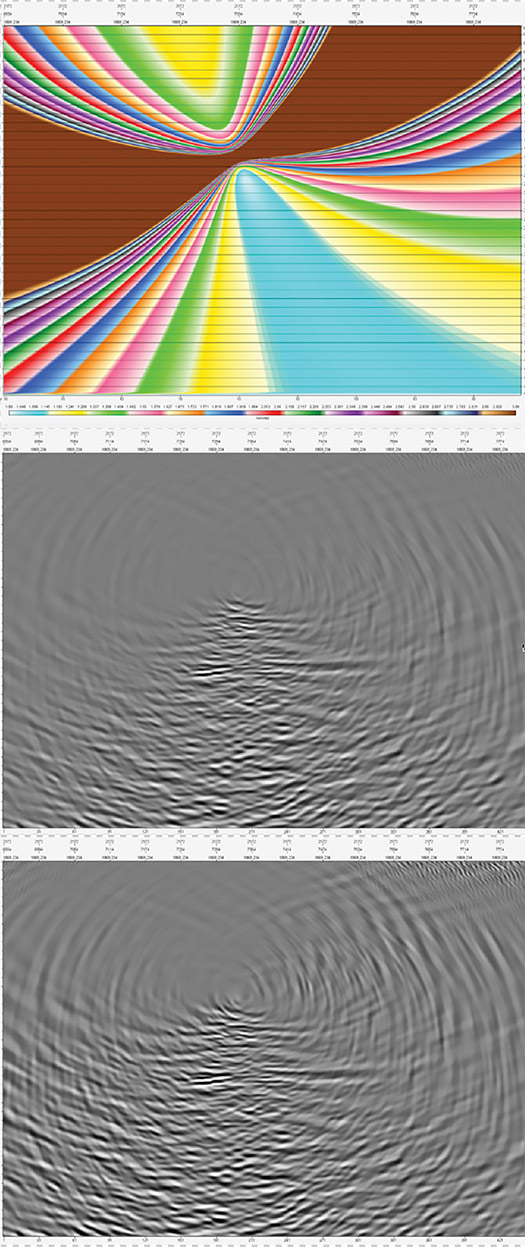
The processed data are migrated through reverse-time migration (RTM) of receiver sub-groups. Each sub-group is comprised of 10 consecutive receivers (~50-m span). These receiver-group image volumes are scaled by the local fiber directivity correction field. This correction term is computed by taking the inner product of receiver slowness vectors (3D ray tracing) and fiber direction vector (well trajectory). An example receiver directivity correction section, as well as images before and after correction, are shown in Fig. 7. The directivity correction display is scaled between 1 and 3.
POST MIGRATION ENHANCEMENT
The fiber directivity-corrected receiver subgroup image volumes are processed through an interpretation-guided selective stacking process, where each image volume is decomposed into several 3D dip components. These dip components are weighted with respect to the background dip field and restacked. This reduces migration smiles while retaining spatial resolution.
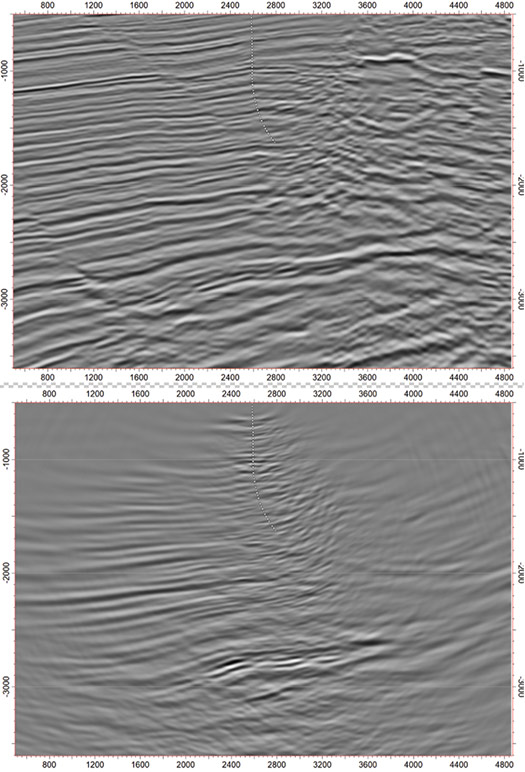
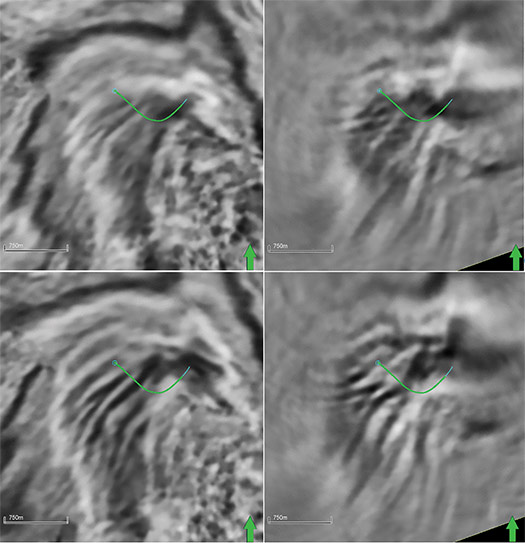
The image volumes are then sorted into VSP common image point gathers (VSP-CIP gathers), and residual or trim statics are applied before stacking by a nonlinear stacking process. To reduce the amplitude differences, due to illumination, a weight cube produced by ray tracing is applied to the RTM stack. Near-well PSDM and DAS 3DVSP images are compared in Fig. 8. Similarly, two depth slices close to the reservoir interval are shown in Fig. 9.
CONCLUSIONS
A DAS 3DVSP survey recorded in very challenging data acquisition conditions is handled through a rigorous processing sequence to yield high-resolution, relative amplitude friendly subsurface image volume. It is demonstrated that through careful processing, DAS data acquired in a high-noise, producing well environment, can yield excellent-quality images with improved resolution in comparison to surface seismic. This case study is relevant to the oil and gas industry because most wells completed with fibers are either injectors or producers. The ability to handle the high flow noise is key for successful seismic monitoring projects using DAS data.
ACKNOWLEDGMENTS
The authors would like to thank Eni and Schlumberger for permission to publish the results, and Eni for the data release.
REFERENCES
- Borland, W., R. Hearn and A. Sayed, “Improving the acquisition efficiency of acquiring borehole acoustic data on a wireline hybrid electrooptical cable,” Expanded Abstracts, 800–804, 86th Annual SEG International Meeting, 2016, doi: https://doi.org/10.1190/segam2016-13951115.1.
- Useche, M. A., A. Martinez, S. Silva, P. Heredia and L. F. Albarracin, 2020, “From checkshot to VSP using the same acquisition footprint enabled by fiber optics,” Expanded Abstracts, 90th Annual SEG International Meeting, doi: https://doi.org/10.1190/segam2020-3428169.1.
- Martinez, A., M. Useche and R. Guerra, “Use of fiber optic acoustics to improve drilling efficiency and well placement,” OTC paper 30866-MS, Offshore Technology Conference, Houston, Texas, 2020.
- Mateeva, A., J. Lopez, J. Mestayer, P. Wills, B. Cox, D. Kiyashchenko, Z. Yang, W. Berlang, R. Detomo and S. Grandi, “Distributed acoustic sensing for reservoir monitoring with VSP,” The Leading Edge, 32, pg. 1278–1283, 2013, doi: https://doi.org/10.1190/tle32101278.1.
- Sayed, A., S. Ali and R. R. Stewart, 2020, Distributed acoustic sensing (DAS) to velocity transform and its benefits: 90th Annual International Meeting, SEG, Expanded Abstracts, 3788–3792, doi: https://doi.org/10.1190/segam2020-3424622.1.
- Tethered BOP technology enables DP rigs to drill in shallow water (June)
- Unlocking the untapped potential of legacy seismic data using modern processing and imaging technology (June)
- Late-life field management: Repair, repurposing and obsolescence management support sustainable well integrity (June)
- Shifting from calendar to usage-based maintenance: Proven results that demand your attention (June)
- Enhancing Lower Tertiary recovery and profitability: The options – Part 2 (May)
- Building a smarter model for sustainable land seismic operations (May)
- Subsea technology- Corrosion monitoring: From failure to success (February 2024)
- Applying ultra-deep LWD resistivity technology successfully in a SAGD operation (May 2019)
- Adoption of wireless intelligent completions advances (May 2019)
- Majors double down as takeaway crunch eases (April 2019)
- What’s new in well logging and formation evaluation (April 2019)
- Qualification of a 20,000-psi subsea BOP: A collaborative approach (February 2019)

