Characterizing seismic facies in a carbonate reservoir, using machine learning offshore Brazil
The authors propose an approach that uses machine learning to characterize carbonate facies in a wildcat (Gato do Mato) prospect in the Santos basin, offshore Brazil. We analyzed different seismic attributes and selected those that best responded to the seismic patterns identified in the study area as input for an unsupervised classification.
The classification method used is the self-growing neural network (SGNN) technique that consists of the following steps:
- Seismic pattern identification in seismic amplitude. The main patterns identified are build-up, debris, carbonate platform and bottom lake facies.
- Generation and analysis of seismic attributes to characterize seismic patterns. We chose Eigen coherence, dip-steered enhancement, relief and relative acoustic impedance to help in seismic characterization.
- We performed principal component analysis (PCA) of the attributes: amplitude filtered from dip-steered enhancement (seismic-driven structural filtering), Eigen coherence and relief.
- Unsupervised seismic classification from the PCA of seismic attributes (item 3 above).

Using this approach, we associated the classified seismic facies with the patterns identified in the amplitude data. The seismic facies allowed us to differentiate the carbonate platforms from the build-up facies. However, the classification encountered difficulties in identifying the patterns associated with lake bottom facies and the chaotic seismic pattern of debris facies.
INTRODUCTION
Seismic attributes are efficient tools for highlighting stratigraphic and structural features. Seismic attributes are highly effective in emphasizing stratigraphic features that can be easily detected (or not) in seismic amplitudes. Taner (2000) defines a seismic attribute as any information extracted from seismic data, whether logical or based on geological/geophysical knowledge. In seismic characterization, seismic attributes are combined to identify seismic patterns that can be associated with depositional environments and diagenetic processes.
Machine learning algorithms have proven to be a powerful tool in solving problems involving large volumes of data. In seismic multi-attribute analysis, these techniques have been used in seismic facies classification for reservoir characterization. They have been a key element in a better understanding of reservoirs, allowing more detailed analyses and more reliable results, reducing the uncertainties inherent in the exploratory process. Furthermore, seismic pattern analysis uses this type of technology in combination with geostatistical methods for facies probability volumes.
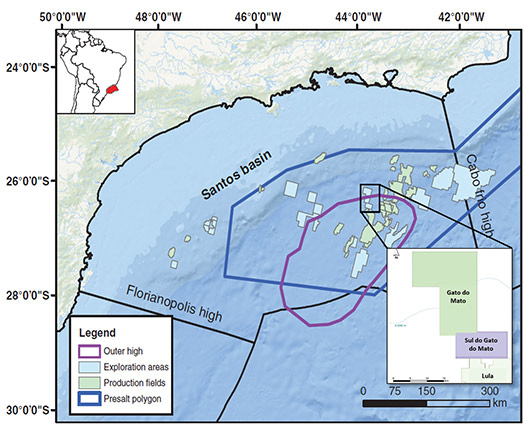
The Santos basin, which is the focus of this study, is Brazil’s largest offshore basin, Fig. 1 (an area of approximately 350,000 km2). It is the primary hydrocarbon producer in the country with an average 2.8 MMboed, out of total Brazilian production of 3.8 MMboed, according to Agência Nacional do Petróleo, Gás Natural e Biocombustíveis. The reservoirs are described as lacustrine carbonates of Aptian age (Buckley 2015).
Given the importance of understanding and analyzing these reservoirs, we propose an approach for the identification and characterization of carbonate facies in the wildcat prospect, which is in the outer high that is the main region of the pre-salt reservoirs of the Santos basin. In our workflow, we chose stratigraphic and structural seismic attributes and performed an unsupervised facies classification, using the self-growing neural network (SGNN), a machine learning algorithm based on growing neural gas.
GEOLOGIC SETTING
The main Brazilian pre-salt reservoirs are in the Barra Velha formation. This formation can be divided into two tectonic sequences by the Intra-Alagoas unconformity, the upper and lower Barra Velha, with the basal belonging to the rift section and the upper belonging to the sag phase. Fig. 2. The Barra Velha formation is characterized by the occurrence of in-situ (shrub, spherulite and laminate) and reworked facies deposited in a lacustrine environment during the Aptian.
The outer high of the Santos basin (Fig. 1) represents an uplifted structure from the basement and marks the transition from volcanoclastic deposition to almost continuous deposition of carbonate during Barremian and Aptian (Buckley 2015). The structure of this high is delineated by NE-SW trend faults. Structural highs influenced the pattern of Cretaceous carbonate accumulation over Neogene sedimentary strata. These highs conditioned the accumulation of pre-salt carbonates, isolating them from the continental clastic sediment region.
METHOD
The seismic data available for analysis is a PSDM (pre-stack depth migration) volume of approximately 1,100 km2, provided by Agência Nacional de Petróleo, Gás Natural e Biocombustíveis (ANP). We interpreted the horizons and faults on this seismic amplitude for interval definition, analysis of seismic patterns and facies classification, Fig. 2.
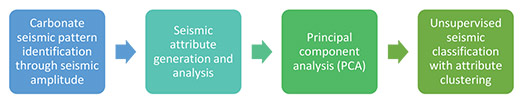
To analyze the main geological configurations and characterize carbonate facies, we performed the following steps, Fig. 3: 1) carbonate seismic pattern identification through seismic amplitude; 2) seismic attribute generation and analysis; 3) principal component analysis (PCA); and 4) unsupervised seismic classification.
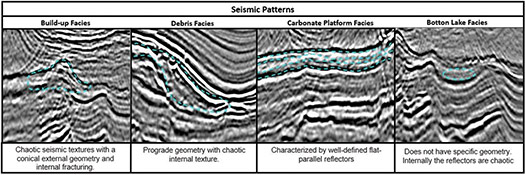
Carbonate seismic pattern identification through seismic amplitude. Recent studies on the characterization of seismic patterns in pre-salt reservoirs show that the main configurations found are build-ups (carbonate mounds), carbonate platforms, debris and bottom lake facies, with the carbonate mounds representing the facies with the best porosity and permeability.
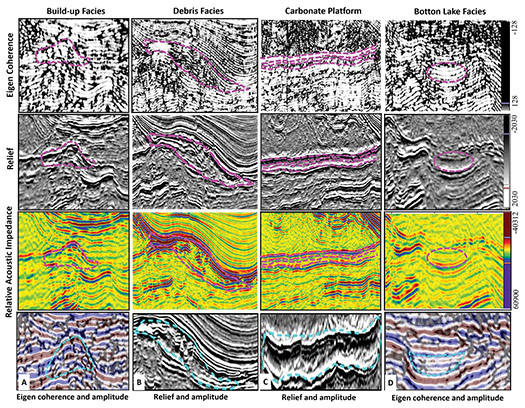
Figure 4 illustrates the seismic patterns identified in the Barra Velha Formation, between the Pre-Alagoas unconformity and the base of salt horizon, previously interpreted. Build-up facies are characterized by chaotic seismic textures with a conical external geometry. Debris exhibits prograde geometry with a chaotic internal texture. The carbonate platform facies show well-defined flat parallel reflectors. The bottom lake facies do not have specific geometry, and the reflectors are chaotic internally.
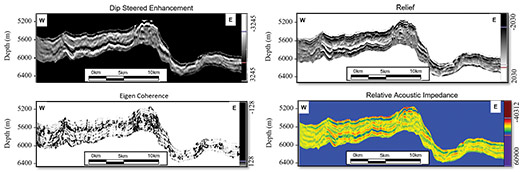
Seismic attribute generation and analysis. The following seismic attributes were generated to assist the seismic characterization, Fig. 5. Dip-steered enhancement (DSE) is performed as a seismic filter oriented to dip and azimuth, which executes lateral filtering along the surfaces. This filtering enhances the lateral continuity of reflectors and removes noises. In this work, we apply the DSE before generating the Coherence Cube attribute, as this attribute is sensitive to the presence of noise.
Eigen coherence attribute is the ratio of the energy of the data’s coherent component to the energy of the original traces within the analysis window. The eigen structure method analyzes a window of traces and determines which wavelet best represents the waveform variability. This wavelet is scaled to fit each input trace, providing the coherence component of the data. The coherence attribute allows the analysis of structural characteristics, since it measures the similarity or non-similarity of seismic data. We use it to understand the lateral extent of geological features (seismic patterns) and to assist in the identification of more fractured regions, such as carbonate mounds.
The relief attribute was developed by Bulhões and Amorim (2005). It is called amplitude volume attribute (TecVA), and it aims to increase the visualization of reflectors and faults, showing small variations in amplitude in a lateral trace-to-trace correlation. This attribute is very useful for highlighting the subsurface geology by detailing the discontinuities and lateral variations of the seismic facies and enhancing the lateral continuities of the reflectors.
Relative acoustic impedance computation is based on seismic trace integration, followed by low pass filtering. This attribute is an indicator of acoustic impedance changes. This is a stratigraphic attribute that assists in identifying and delimiting layers.
Principal component analysis (PCA). PCA is the process of computing the principal components on the data. It can be used before the seismic classification as a filter to reduce the input space dimension. The low variability of seismic data makes the PCA a very efficient method for reducing the samples in the input space. When applied in seismic multi-attribute facies classification workflows, the transformed data can identify and differentiate hidden features. The results can improve seismic pattern classification.
Mathematically, PCA finds the principal directions in multi-dimensional data and determines the optimal shift and rotation of the data to be expressed in those principal directions. In addition, it classifies the directions according to a decrease in the greatest contribution of each component, which can be used to reduce dimensionality. In this study, the seismic attributes used as input for the PCA were the seismic amplitude filtered by the DSE, Eigen coherence and relief attributes.
Unsupervised seismic facies classification with attribute clustering. Attribute clustering is a method for automatic unsupervised facies classification. For this, we can use a machine learning algorithm, such as Self-Growing Neural Network (SGNN) or Growing Neural Gas. This method uses a system based on neurons that behave as a gas during the training process.
The SGNN technique builds a topology defined dynamically that maintains the neighborhood relationships of the data. Two principles are honored: i) two neighbor elements in data space continue as neighbors in the topology space, and ii) more neurons are assigned to regions with a dense level of information. Thus, several neuron families are created, based on the data similarity and propagated later into seismic using a Bayesian approach.
Three steps are necessary to perform the seismic facies classification. The first is selection of the seismic attributes and the interval for the classification. The neural network is then trained on the input data. In this step, the algorithm identifies the main data trends that can be used to classify the data. Finally, in the classification part, a facies volume is generated with the related probability facies. The trained neural network will be used to estimate probabilities for each facies. As result, we have a most probable facies volume and probability volumes for each facies.
RESULTS
Before the attribute computation, the seismic amplitude was filtered, using dip-steered enhancement (seismic-driven structural filtering) to help improve continuity of the reflectors and reduce noise and migration smiles. This attribute was then used as input for the Eigen coherence computation. In Fig. 6, we can observe the results of the Eigen coherence, which emphasize the build-up and bottom lake facies. Meantime, when analyzing the same attribute, we observe an internal chaotic texture and a fractured central region in the debris facies, while the carbonate platform facies show flat parallel and well-defined reflectors.
The relief attribute accentuates the reflectors’ continuities and chaotic zones and helps to identify the debris seismic facies and the carbonate platform. The debris patterns present a prograde geometry with a fault system in the proximal part and a chaotic pattern in the distal part. The relief attribute shows the carbonate platform as flat parallel and well-defined reflectors. We decided to compute the relative acoustic impedance to obtain a better resolution volume with information about acoustic impedance changes.
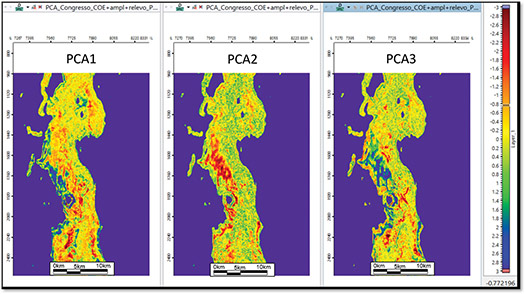
The contribution of each component of the PCA was about 33%. We chose only two of the three components where the differentiation between build-ups and the carbonate platform was more evident, Fig. 7. Later, those components, together with the relative acoustic impedance volume, were selected as input for the seismic classification.
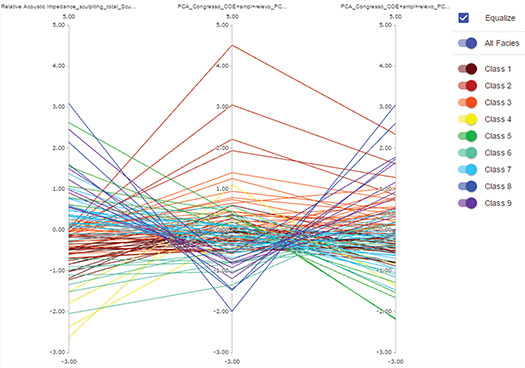
The interval for the unsupervised facies classification was defined by the base of salt horizon and the pre-Alagoas unconformity. Several training runs were carried out until we found an optimal number of neurons. In this case, a model with nine classes produced the best results to represent the carbonate seismic facies. Some quality controls were performed to guarantee more confidence in the results. For example, a parallel plot allowed the assessment of every attribute contribution during the neuron training. According to the plot shown in Fig. 8, there is a good distribution or variation of every class neuron for the different attributes, confirming that all the attributes contribute to the prediction.

During the classification stage, we used a K nearest neighbor (KNN) method, which allows the estimation of the most probable facies by defining the neuron influence area as a Gaussian function (weight = e-distance). Smoothing was performed on the results from the seismic dip and azimuth volumes. Finally, we obtained a most probable facies volume and the probability for each class.
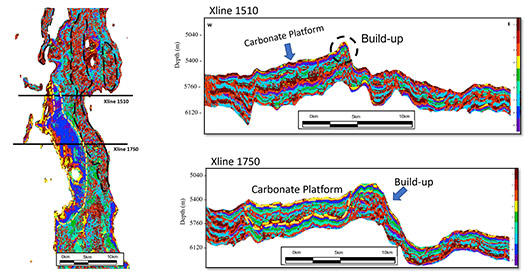
We associated some seismic facies with the seismic patterns of the Barra Velha Formation. We obtained a clear differentiation between the carbonate platform and more fractured areas related to the build-ups. Facies in dark blue (class 8) and violet (class 9) are associated with the carbonate platform because of their continuity and flat behavior. The brown (class 1) and orange (class 3) facies are more concentrated in areas that show more discontinuities (fracturing) like the build-ups. These types of facies are more present in areas closer to the main faults, Fig. 9.
The debris facies were not detected in the interval used for the facies classification workflow. Similarly, the bottom lake patterns did not appear very evident, impeding their association with one of the seismic classes. The facies occurrence probabilities are shown in Fig. 10. The carbonate platform (dark blue and violet) and build-ups (brown and orange) present a high probability of occurrence. This type of information is extremely useful for uncertainty analysis associated with facies modeling.
CONCLUSION
The amplitude, Eigen coherence, relief and relative acoustic impedance attributes help the identification and characterization of build-ups, carbonate platform, debris and bottom lake seismic facies, which are the main seismic patterns found in the Brazilian pre-salt reservoir. Those patterns have the following characteristics: Build-up facies appear on the structural highs, near faults with high throws, with chaotic seismic texture and parallel and well-defined conic external geometry; the carbonate platform facies is located in horsts and presents flat-parallel and sub-parallel high amplitude reflectors; debris facies occur in the fault borders and exhibit a prograde geometry with chaotic internal texture. Finally, the bottom lake facies are found in structural lows and present transparent seismic facies.
Principal component analysis before the seismic classification aids in the discretion of build-ups and carbonate platform facies, improving the classification results. The attribute clustering method, based on a machine learning technique, is an effective approach to differentiate the fractured zones mainly associated with build-up facies in the wildcat prospect, Santos basin, Brazil.


- Tethered BOP technology enables DP rigs to drill in shallow water (June)
- Late-life field management: Repair, repurposing and obsolescence management support sustainable well integrity (June)
- Shifting from calendar to usage-based maintenance: Proven results that demand your attention (June)
- Enhancing Lower Tertiary recovery and profitability: The options – Part 2 (May)
- Executive viewpoint: Methane monitoring goes digital (May)
- Simplified intelligent completion architectures improve zonal control economics (May)
- Subsea technology- Corrosion monitoring: From failure to success (February 2024)
- Applying ultra-deep LWD resistivity technology successfully in a SAGD operation (May 2019)
- Adoption of wireless intelligent completions advances (May 2019)
- Majors double down as takeaway crunch eases (April 2019)
- What’s new in well logging and formation evaluation (April 2019)
- Qualification of a 20,000-psi subsea BOP: A collaborative approach (February 2019)

