Optimizing future drilling operations by merging design with digitized structural data
During the design phase of a subsea exploration well, a wide range of design assumptions must be considered. The range in high and low estimates for parameters, such as soil support or riser and BOP mass and damping forces, may be considerable. In general, conservative parameters must be selected, leading to worst-case scenarios, which again may lead to limited operational windows, introduce high-cost mitigating actions, or in the worst-case scenario, prevent operations from being carried out.
For more than three years, Asker, Norway-based 4Subsea has been involved in delivering a combination of pre-operational assessments and monitoring during operations for seven consecutive drilling campaigns in the Barents Sea and the North Sea. This has included upfront structural design analyses for the conductor and surface casing, as well as subsea well integrity monitoring (SWIM) during well operations.
The measured riser and BOP response represented a total of 371 operational days, with the BOP connected to a well with two different semisubmersible drilling rigs.1 The structural integrity of the well foundation and soil support was verified by combining the structured data obtained from measurements with the design information. A sensor system was fitted to the riser and BOP on mobile drilling units to monitor soil and structural integrity.
REDUCED CONSERVATISM
Structured operational data and measured response are used to improve analysis models, thereby leading to reduced conservatism. For cases of re-entry on an existing exploration well with heavier equipment, the measured soil support can be used to rule out some worst-case scenarios and enable the upcoming operation. A case example of an exploration campaign enabled by the design loop will be shown.
The typical set-up when drilling a subsea exploration well in a harsh environment is to use a semisubmersible drilling unit with a marine drilling riser and a subsea BOP. During such a drilling campaign, the well conductor acts as the well’s foundation and must, hence, be designed to withstand the loads from such operations.
The dominating part of this load is the bending load introduced by the tension and angle in the subsea flex joint. As previously presented,2,3 the magnitude of the wellhead bending load is given by the following factors:
- The height of the BOP stack
- As the height of the BOP increases, the moment arm for the shear force acting at the top of the BOP will increase. Thus, an increase of the moment arm will hence increase the wellhead bending moment
- Submerged weight of the lower marine riser package (LMRP) stack
- The operational requirement with respect to riser tension is typically that the LMRP connector shall be subjected to given overpull to ensure safe disconnect. An increase of the submerged weight of the LMRP will result in increased tension in the subsea flexjoint. Because of the increased tension, the shear force at the top of the BOP will increase, following an increase of the bending moment
- The total mass of the BOP and the LMRP stack
- The dynamic amplification of the BOP is a function of the total mass of the BOP stack. Increased mass will typically move the BOP wellhead system resonance period closer to the weather peak period, giving increased dynamic load at the wellhead datum
- The rotational stiffness of the subsea flexjoint
- The rotational stiffness of the subsea flexjoint introduces a bending moment at the top of the BOP. This is transferred directly down to the wellhead datum through the BOP. Increasing flexjoint stiffness gives higher bending load at the wellhead datum.
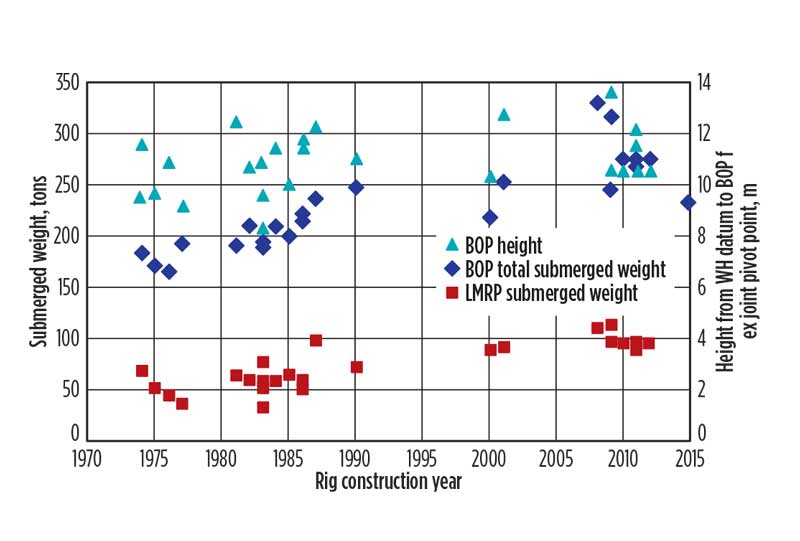
The height and weight of the BOP stack has increased significantly over the last 40 years, due to more stringent safety requirements. This increase is illustrated in Fig. 1, where the BOP total mass, the LMRP mass and the height to the BOP pivot point are plotted against the rig building year. A clear, increasing trend is seen for all three of these factors.
Additionally, the need for mobile offshore drilling units (MODUs) to cover a wider range of water depths introduces the need for higher-pressure class on the subsea flexjoint. The consequence of the higher-pressure class of the subsea flexjoint is increased rotational stiffness. The increase in BOP size and flexjoint pressure rating, has led to a need for higher structural capacity for the wellhead systems.
CONDUCTOR DESIGN
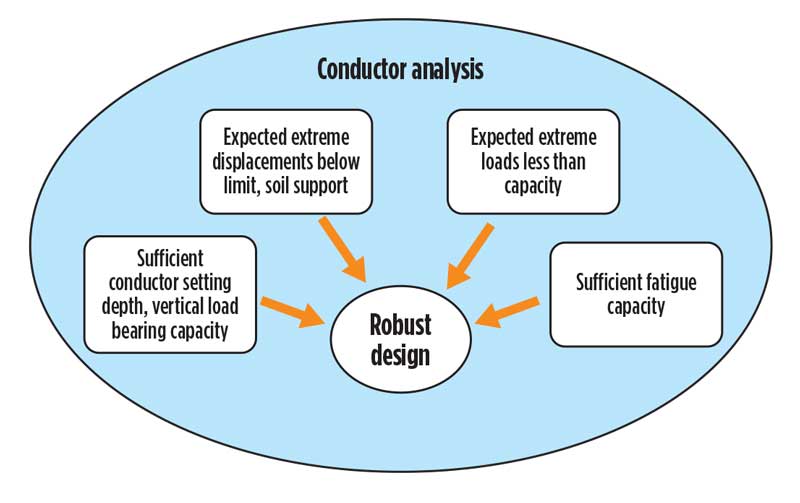
The main task of the conductor is to act as a foundation for the structural loads applied to the wellhead. Thus, the conductor must be designed to withstand the loads introduced by the riser. The purpose of a conductor analysis is to ensure a robust design. The main content of a typical analysis is summarized in Fig. 2, and includes evaluating the following:
- Axial bearing capacity
- Lateral soil support
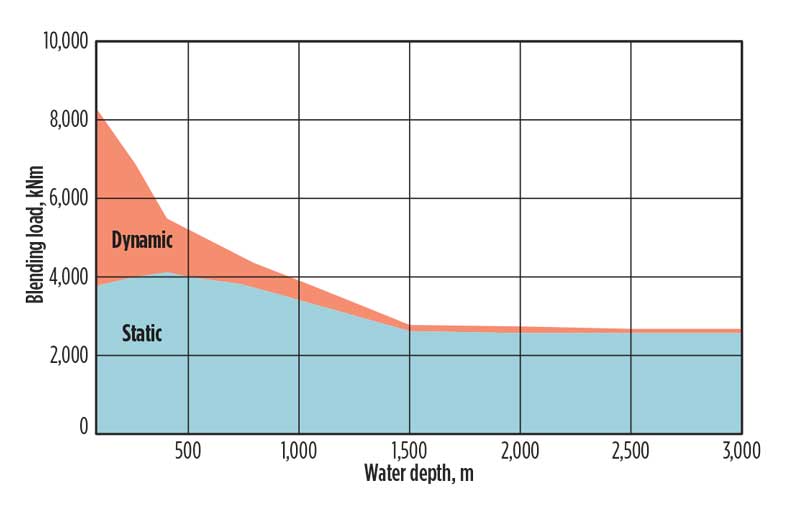
- Structural extreme load capacity check, to ensure the well can withstand the extreme loads. Typical extreme loads from NORSOK are shown in Fig. 3.
- Structural fatigue check.
The conductor analysis will typically result in a set of operational requirements for the given drilling operations. These will normally be maximum allowable vessel offsets for different scenarios, combined with the maximum allowable wave height for the operation, for wells where the dynamic load is significant.
As the design loads increase, the required structural capacity of the conductor housing will have to be increased, accordingly. The most common approach is to enhance the conductor size from 30 in. to 36 in. Additionally, this will raise the exposed area toward the soil, and hence, the soil support capacity is also increased with the larger conductor. However, this has a significant cost impact, and it requires special handling equipment and additional rig time to extend the top hole from 36 in. to 42 in., while also introducing increased cement cost.
SOIL SUPPORT
The most important parameter, with respect to conductor design (for a satellite well), is the support given by the soil. In the analysis models, the soil support is modelled as soil reaction springs. These include py springs in lateral direction, and t–z springs (skin friction) and q–z springs (end bearing) in axial direction. The lateral soil support typically governs the conductor design.
The properties of the supporting soil are typically established from an upfront site survey. This will, in most cases, include several cone penetration tests (CPTs), in rare cases supported by core samples. The design soil parameters will, hence, have to be established, based on CPTs combined with experience from the area.
A typical scenario is that the soil’s upper layer is dominated by soft clay, with a transition to a firmer 3 m to 15 m below the seabed. By far, the most important parameter for the conductor design assessment is the distance down to the firm support. CPTs rarely go deeper than 5 m to 10 m, often without confirming the elevation of the firm soil layer. It is, therefore, difficult to get confirmation of the depth of the shift between the soft and firm soil support. This often will lead to discrepancy between the high and low estimates of the soil design parameters.
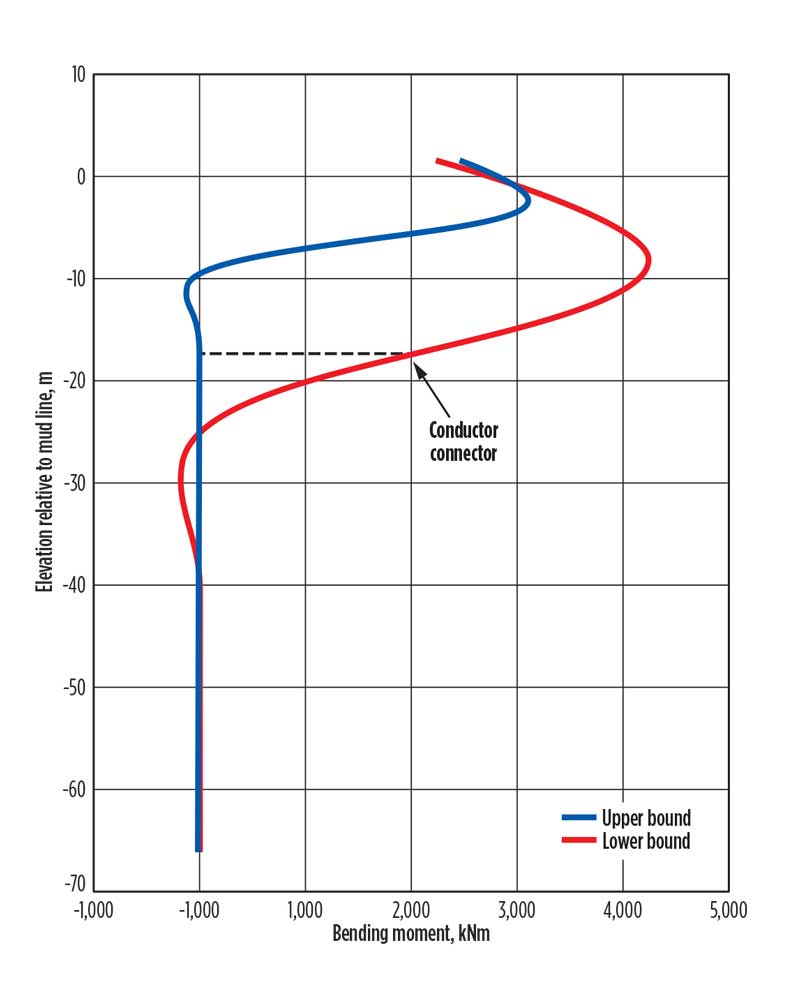
The consequence is illustrated in Fig. 4, where a typical bending load distribution along the conductor for the high-stiffness and low-stiffness design soil is presented.
The bending moment will increase with conductor depth, until it reaches a firm soil layer where the load is transferred to the soil. Hence, if the same load is applied on the wellhead datum for both soil estimates, the softest soil profile will yield the largest maximum bending moment. Additionally, the elevation of the maximum load will be deeper, compared to the case with the stiffer soil. The maximum bending load is the driving factor when determining the required conductor size. The uppermost connector on the conductor is typically located around 15 m below the mudline.
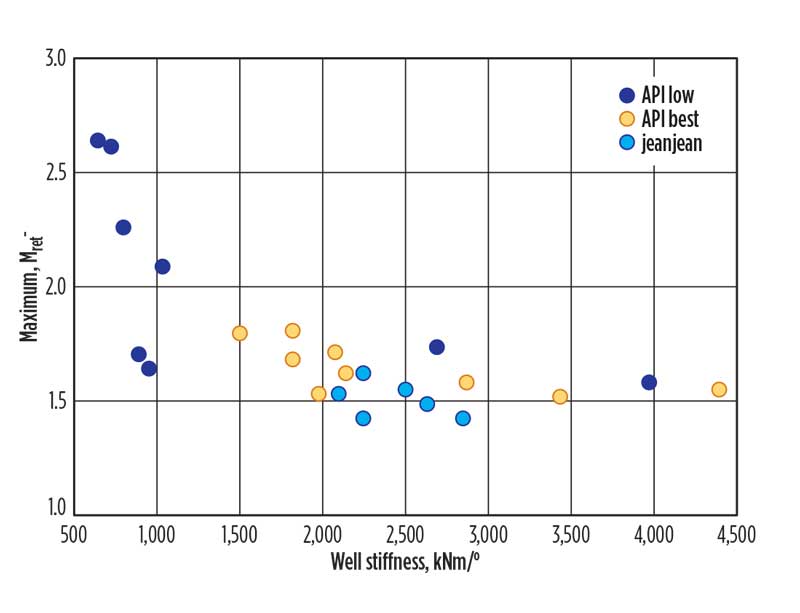
The same dataset also has been used to compare different soil models from design analyses with the actual measured response.4 The purpose of including both the low-estimate and a best-estimate soil parameter is to illustrate the effect of conservatism taken when establishing soil properties from limited data.5
Figure 5 shows where the maximum ratio of the peak load along the conductor to the applied load is plotted as a function of the well stiffness. This shows that the effect of going from the low-estimate to the best-estimate soil is significant. Therefore, improving the quality of the soil site survey will potentially support reduced conservatism in the conductor design.
In addition to affecting the load distribution on the conductor, the well support stiffness also affects the global riser loads, i.e. the dynamic loads. Two opposing effects drive the loads. The static load, due to offset and current, is reduced as the well becomes softer. This is because the relative angle between the riser and the BOP is reduced for a softer well support. This leads to reduced static bending load at the wellhead datum for softer wells. The opposing effect is the dynamic amplification of the load over the BOP. As the BOP resonance period is typically in the range of 1 sec to 5 sec, which is below the peak period of the wave excitation force, a softer well will increase the resonance period, which moves closer to the wave excitation.
For example, the maximum dynamic load from the global riser analysis of one of the wells with Hs=3.5 and wave spectral peak period from 4 sec to 20 sec, using different soil support. As the BOP resonance period increases (softer well support), the dynamic load on the wellhead also rises.
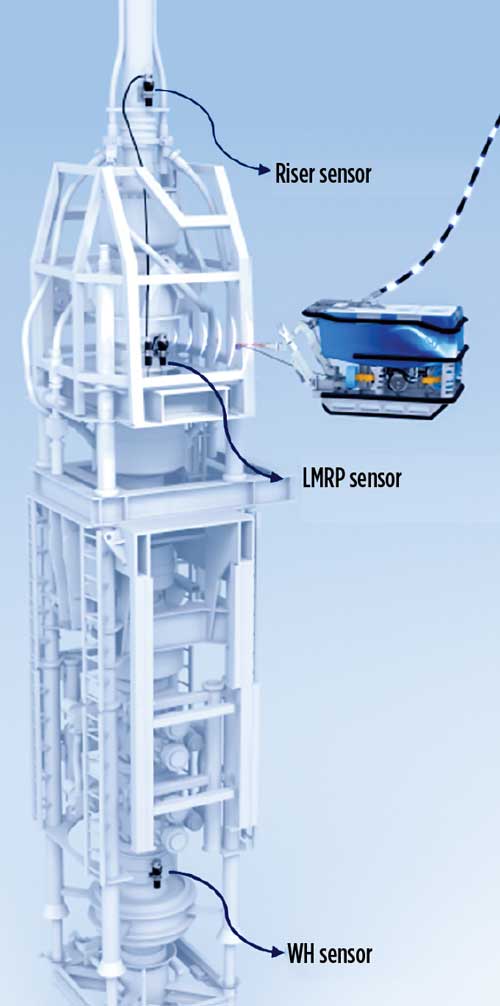
Subsea well integrity monitoring. All the reported measurements were carried out using the sensor system, Fig. 6. The illustration shows the setup in 2017. From 2019, the system also includes a strain sensor kit. The measurement system consists of three integrated motion units (IMU) measuring accelerations and rotation rates at 10–Hz sampling frequency:
- One sensor located directly above the subsea flex joint (riser sensor)
- One sensor located directly below the subsea flex joint (LMRP sensor)
- One sensor located near the BOP connector (wellhead sensor).
The accelerations and rotational rates are converted into angles. Additionally, some integrity parameters for the well are calculated. These integrity parameters assume that drilling with a subsea BOP for most exploration wells can be expressed as a simplified pendulum model, for instance. The following parameters were calculated:
- The well rotational stiffness
- The BOP resonance period
- The BOP damping ratio
- The wellhead rotational depth.
The integrity parameters and the measured response are stored and structured for each well, allowing for the use of these data for future operations.
Comparing upfront design analysis with measured response. All relevant data, both for the upfront design analysis and from the measurement campaign, are stored in a structural storage or data reservoir. Design input, soil site survey data, analysis models, analyses results, and measured responses are stored together with relevant metadata. This enables a large-scale comparison of the analysis and measurements.
The benefit of using the same vendor for measuring and performing upfront analysis for several exploration wells with the same vessel is that the measured response can be utilized to improve the analysis models for future campaigns. It should be noted that the comparison and improvement of the analysis model should be done on parameters that are rig–and riser–specific, not on parameters influenced by the well response, since operations are carried out on various wells.
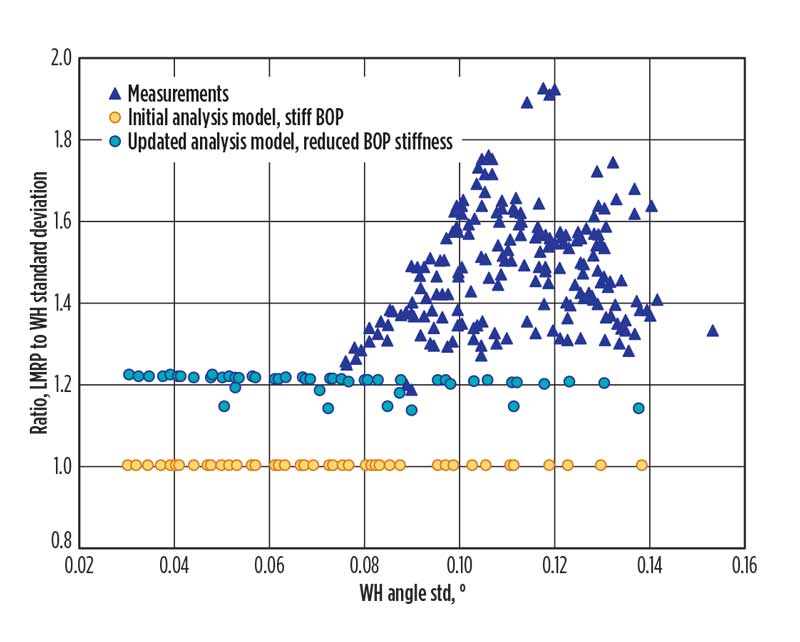
One example of such a parameter is the BOP stiffness, where the BOP is often modelled as an infinite stiff beam in global riser analyses. A significant difference between the wellhead and the LMRP sensor dynamics was observed. By using the measured response from the LMRP sensor and the wellhead sensor for several wells, the BOP stiffness can be estimated. The ratio between the LMRP and the wellhead measured angle standard deviation is presented together with analysis results, Fig. 7.
The initial riser model was too stiff, and by reducing the bending stiffness of the BOP, a better match between analyses and measurements can be achieved.
Re-entering an existing exploration well. Further benefits from measurements can be achieved when re-entering an existing exploration well. In this case, the measured response can be used to establish the actual stiffness of the well, eliminating the need to do conservative estimates from the uncertainty, from the site survey. By combining the integrity parameters (BOP resonance period, rotational depth and well stiffness) the softer soil support scenarios can be eliminated.
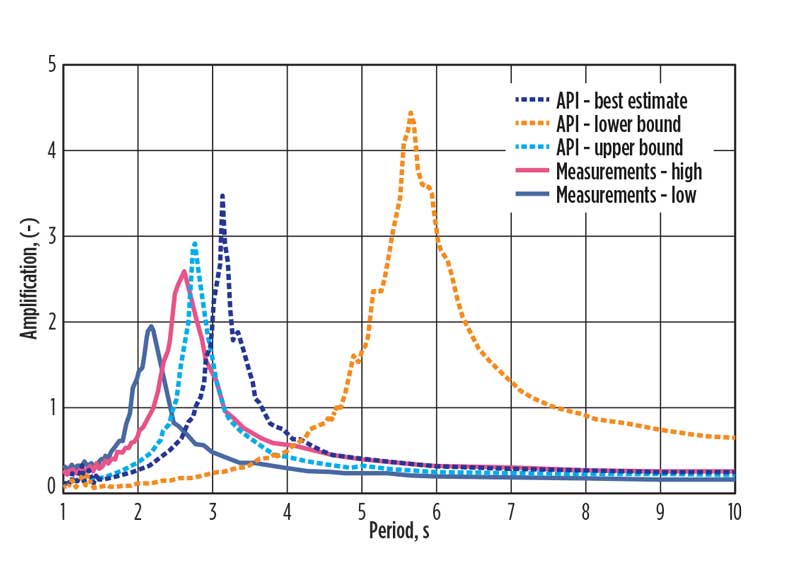
An example of this is shown in Fig. 8, where the dynamic amplification is found by dividing the response amplitude specter for 1 hr of response from the riser and the wellhead angle. The dashed curves are from the analysis model over the BOP. Analyses with different soil profiles are compared with the measured response.
The plot shows three different soil profiles (lower bound, upper bound and a best estimate curve), all established using the soil spring formulation from API RP 2GEO.6 Two different amplification spectra from the measurements are presented (the stiffest and the softest hours from the measurement campaign), as the measured response showed a softening behavior over time.
The comparison clearly shows that the lower bound soil support scenario can be ruled out. This comparison is from a campaign where the initial work on the well was done with one MODU. Later, another MODU went back to the well to complete the operations.
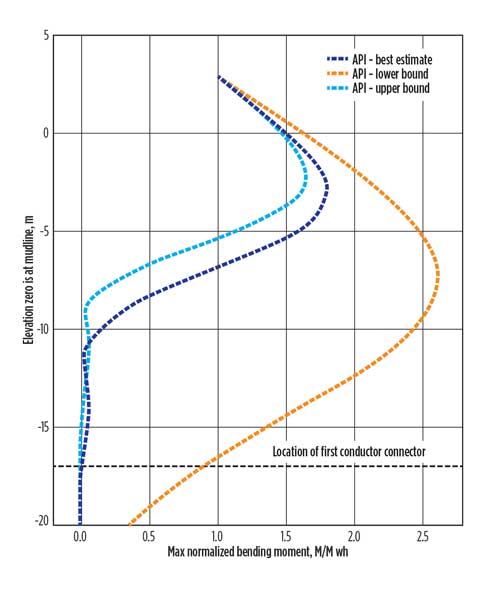
The knowledge of the actual well support was then used in the upfront conductor analysis to improve the operational limits for this operation. The effect on the maximum dynamic bending moment from the analyses of the different soil profiles is presented in Fig. 9.
The maximum observed conductor bending moment was reduced 35%, and the bending moment in the first conductor connector was reduced to close to zero. This had a significant impact on the operational limits, as well as the fatigue prediction of the connector for the upcoming operation. The improved fatigue prediction was positive for the operation, as the initial analyses of the re-entry of the well showed unacceptable fatigue damage.
It should be noted that even the best estimate and the upper bound soil support are too soft. This indicates that the soil springs used in the design should be stiffer. Aggregated measurement data from several wells may, in the future, be used in the development and verification of more sophisticated soil models and improve future design analyses.
VALUE ADDED
Using an approach, where structured data from design analyses are combined with measured data from the actual operation, is beneficial both for the ongoing operation and for future conductor designs. A pre-requisite for such an approach is to store all relevant information in a structural manner with relevant metadata. This enables a learning process, whereby knowledge from the operational phase can be fed into the design of future wells, to improve the operational window and reduce conservatism in well conductor design. This includes both structural and fatigue performance of the wellhead system. This will potentially allow for reduced conductor dimensions, reduce the number of conductor joints, allow for less complex connectors and simplify offshore operations; in total, reducing the investment and operating costs.
In the case of a re-entry of a subsea well, the measurements can be used to rule out the most conservative estimates of the soil support, increasing the allowable vessel offsets and increasing the allowable wave height for the upcoming operation. This, again, may reduce time for waiting on weather and reduce costs related to station-keeping. Further on, enhanced models will provide improved wellhead fatigue estimates, which extend the well service life and enable increased production.
For wells with challenging soil support conditions that lead to limitations on the well operations (Hs or offset limitations), the measured response can be used to rule out the most conservative soil estimates, extending the operational windows and reducing the cost of the operation.
4Subsea is constantly developing analysis methods and measuring algorithms, in order to deliver more value to the customer. The SWIM measurement system, for example, now includes strain sensors, which enable direct measurement of bending moment. This will, again, reduce the conservatism in the estimates of bending loads imposed by the riser and BOP on the top of the subsea well.7
PATH FORWARD
The company is currently performing more sophisticated soil models for conductor analyses. The methodology used to compare global riser and BOP response with the measurements has been improved significantly. This now includes a more extensive set of system state parameters and how these can be extracted from the measurements.8 The company also has developed a methodology, where these state parameters can be used directly as input to a global riser analysis to obtain more accurate prediction of the riser response.9
REFERENCES
- Holden, H., I. Marre, H. G Holm, and R. Næss, “Enabling drilling operations using structured data and measured response,” OTC paper 27726-PT, May 2017.
- Holden, H., M. Russo and P. Bjønnes, “A simplified methodology for comparing fatigue loading on subsea wellheads,” OMAE paper 2013-11529, ASME 32nd International Conference on Offshore Mechanics and Arctic Engineering, June 2013.
- NORSOK, “NORSOK standard U-001, Subsea production systems,” Edition 4, 2015.
- Jeanjean, P., “Re-assessment of P-Y curves for soft clays from centrifuge testing and finite element modeling,” OTC paper 20158, Offshore Technology Conference, Houston, Texas, May 2009.
- OilStates technical manual for subsea flexjoint assembly, http://oilstates.com/wp%C2%AD%20content/uploads/Subsea-Flexible-Joint-Technical-Manual.pdf
- Holden, H., H. G. Holm, Y. Zhang, V. Smith and R. Nress, “Calibration of soil spring models for conductor analysis based on field measurements,” Proceedings, ASME 36th International Conference on Ocean Offshore and Arctic Engineering, Trondheim, Norway, June 2017.
- ANSI/API, “RECOMMENDED PRACTICE 2GEO, Geotechnical and Foundation Design Considerations,” Addendum 1, 2014.
- Holden, H., V. Martinsen and Å. Grønningsæter, “Using a new, autonomous and easy-to-install strain sensor for monitoring of dynamic loads on a subsea BOP in order to reduce conservatism and increase service life of subsea equipment.” OTC paper 30862-MS, Offshore Technology Conference, Houston, Texas.
- Cetin, A., H. Holden and V. R. Solum, “Robust method for wellhead loads estimation based on lower stack motion measurements,” OMAE paper 2020-6486, International Conference on Ocean, Offshore & Arctic Engineering, 2020.

- Digital transformation/Late-life optimization: Harnessing data-driven strategies for late-life optimization (March 2024)
- The reserves replacement dilemma: Can intelligent digital technologies fill the supply gap? (March 2024)
- Digital tool kit enhances real-time decision-making to improve drilling efficiency and performance (February 2024)
- Digital transformation: Digital twins help to make the invisible, visible in Indonesia’s energy industry (January 2024)
- Digital transformation: A breakthrough year for digitalization in the offshore sector (January 2024)
- Quantum computing and subsurface prediction (January 2024)
- Applying ultra-deep LWD resistivity technology successfully in a SAGD operation (May 2019)
- Adoption of wireless intelligent completions advances (May 2019)
- Majors double down as takeaway crunch eases (April 2019)
- What’s new in well logging and formation evaluation (April 2019)
- Qualification of a 20,000-psi subsea BOP: A collaborative approach (February 2019)
- ConocoPhillips’ Greg Leveille sees rapid trajectory of technical advancement continuing (February 2019)

