Disruption and commoditization of the proppant industry
What was once an exclusive, niche industry, providing essential materials used for oil and gas well completions, the proppant industry has undergone substantial and sometimes abrupt changes within the past 10 years. The greatest changes have been in the last five years.
In the not-too-distant past, high-quality proppant resource deposits were explored, mined and washed meticulously, and screened precisely into specific mesh sizes, such as 12/20, 16/30, 20/40 and 30/50. They were tested rigorously before, and after, being delivered to onshore and offshore well locations.
For states such as Wisconsin, Illinois and Georgia, which supplied a majority of the market’s natural frac sand and kaolin feedstock for ceramic proppants, the deposits were not located near the oil and gas plays. Therefore, most frac sands and man-made proppants, including resin-coated and ceramic proppants, were delivered by railcars to increasingly large and sophisticated bulk terminals near oil and gas fields.
The supply industry, being mostly privately held, focused on long-term sustainability and market diversity while experiencing competitive growth, stable pricing and innovative technological advancements to assist hydraulic fracturing. Due to unconventional wells, drastic changes have occurred not only in proppant demand and supply, but also in the purchasing hierarchy, logistical services, access to capital and the quality expectations regarding today’s proppant.
Generally, weaker oil and gas prices will lead to a wider acceptance of lower cost and lower-quality proppants, to reduce completion costs and preserve cash. Proppant suppliers, service companies and operators have had to become principally focused on cost reduction, and the result is that proppant is now largely commoditized. Proppant suppliers, not unlike those companies in the 1980s and 1990s that established proppant terminals to differentiate themselves, have embarked on establishing new, in-basin sources of sand, as well as last-mile delivery options.
Last-mile offerings also have expanded the opportunity to increasingly sell directly to the operator. Due to the supply surge, new in-basin sources of sand are facing the same pricing pressure as the more traditional proppants. In short, the traditional hierarchy no longer exists, even as the demand volumes of proppant remain at an all-time high. The paradigm has truly shifted.
HISTORICAL OUTLOOK: FROM STABILITY TO DISRUPTION
Whereas hydraulic fracturing’s roots date back to 1947, proppants were increasingly developed and viewed as specialty products in the mid-1970s and 1980s. Geopolitical events (e.g., oil embargo) drove innovation and expansion within the U.S. The first high-strength proppants and resin-coated proppants were introduced in the mid-1970s. As innovation was arguably driven by operator needs, the industry was largely supplied by only a handful of sand, ceramic and resin-coating companies to a few, yet highly capable, service companies. The purchasing hierarchy was firmly established.
With very few exceptions, the hierarchy was operator to service company to proppant supplier. A sophisticated proppant supplier could carefully discuss technical issues with an operator, but proppant prices were rarely, if ever, discussed. The supply and allocation of proppants was the domain of the service company, and the proppant of choice was overwhelmingly 20/40 and coarser sizes.
This model continued relatively unchallenged into the mid-2000s. The early 2000s were the proving ground for shale gas, and it was not until 2002 that the global proppant market first surpassed 4 billion pounds (2 million tons). The development of horizontal drilling and slickwater fracturing completions in unconventional resources led to substantial increases in demand throughout the decade.
In part, due to the impact of Hurricanes Rita and Katrina in 2005, the period from 2005 to 2010 was largely a gas-driven industry. Periodic proppant shortages and targeted hydrocarbon type (i.e., natural gas) resulted in operators incorporating finer mesh proppants, such as 40/70 resin-coated sand and 40/80 ceramics, and the wider adoption of alternative grades of sand, such as 30/70 and various types and sources of “100 mesh” sand.
Still, in 2006, a vast majority of proppants was supplied by four primary sand producers, two resin-coating companies and three ceramic proppant manufacturers. By the end of 2010, the number of companies producing frac sand increased to over 40, and the number of resin coaters more than tripled. The proppant market exceeded 38 billion pounds (19 million tons) in 2010, more than 10 times that of 2000.
This decade of exponential growth resulted in new proppant suppliers, service providers, and independent oil and gas companies that were not necessarily bound by the traditional purchasing hierarchy. The combination of proppant price inflation and extensive lead times for specific grades of proppant lead to uncertainty in security of supply.
Several key operators commenced to vertically integrate some of their proppant supply requirements, most notably EOG Resources in Hood County, Texas, in 2007, and Chippewa Falls, Wis., in 2011. Others included Southwestern Energy’s DeSoto Sand Plant north of Little Rock, Ark., in 2009, and Pioneer Natural Resources’ acquisition of multiple facilities from Carmeuse Industrial Sands in early 2012.
Meanwhile, select new service companies were not opposed to this initial self-sourcing trend, as it allowed them to focus available capital on their pressure pumping services. Newly established sand producers and international ceramic proppant brokers were also not bound by the traditional supply chain. One can argue that the proppant industry increasingly became contract, as opposed to relationship, based.
The 2010s continued to usher in disruptive change. In 2012, the first publicly held frac sand companies emerged. This resulted in a lifting-of-the-veil, so to speak, on the largest proppant segment. Sand became a Wall Street sensation, while the industry adapted to more of a liquid-driven industry, as oil prices surged to over $80/bbl and even $100/bbl.
Proppant demand for all types surged, including Chinese proppant imports to the U.S. and Canada. In 2014, total proppant demand surpassed 100 billion pounds for the first time in history, as 135.5 billion pounds (67.75 million tons) were supplied. In part, due to 20/40 sand and ceramic shortages, operators expanded the use of finer-mesh 40/70 and 100-mesh sands in slickwater and hybrid completions in liquid applications. Substantial capital swelled into the industry to expand all types of proppant capacity.
The 2015-2016 period will be remembered as the first two-year industry recession to impact the industry in over two decades. In February 2016, WTI oil price retracted to just over $30/bbl, the lowest monthly oil price since April 2004. Premium ceramic and resin-coated proppants were impacted the greatest, as demand fell to 2010 and prior levels. Sand fared better, in terms of total volumes supplied, but all proppant types were discounted to levels not seen since the mid-1980s.
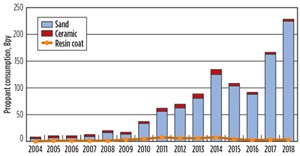
Ironically, 2015 and 2016 were, at that time, the second- and third-largest years in terms of total proppant demand, as a result of increased proppant intensity completions. In terms of volume, demand rebounded significantly and established new demand highs in 2017 (167.78 billion pounds) and 2018 (229.8 billion pounds), but proppant prices remained under pressure, as total frac sand-rated capacity, alone, exceeded 440 billion pounds in early 2019.
THE NEW NORMAL
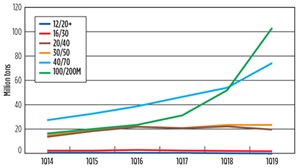
Coupled by technological advancements, current operators successfully pump tremendous amounts of fine-mesh proppant into unconventional wells, mostly consisting of 40/70- and 100-mesh sand. It is not uncommon to pump even wider mesh sizes. To say “100 mesh” sand is now an all-encompassing term that includes 70/140, 50/140, 40/140 and 50/200 sieve distributions. The massive volumes pumped per well quickly caused proppant to become an even greater price factor in hydraulic fracturing.
To meet the increasing demand, and without significant regulatory constraints, new deposits quickly entered the market. Sand suppliers—both existing and new, private equity-backed companies—targeted new in-basin deposits at an unprecedented pace, particularly in the Permian basin.
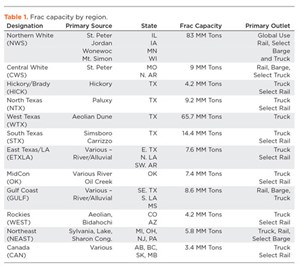
Nearly 70 million tons of newly rated sand capacity came online in just the past year. The West Texas capacity, alone, exceeded 64 million tons in 2018, with plans to further increase supply. Other regions have followed suit: South Texas and Oklahoma are on track to add over 10 million new tons as early as mid-2019. Deposits continue to be tested from Colorado and Louisiana. In total, it is forecast that the frac sand capacity could reach almost 300 million tons by 2020, with the main product being 100-mesh regional sand.
THE RESULT?
There is an oversupply of proppant, accompanied by price deflation. Northern plants now struggle to compete with regional mines, due to logistical costs. Regional mines struggle to compete among themselves. In less than five years, the proppant industry has seen the value proposition of each primary proppant type methodically dissected: first ceramics, then resin-coated proppants, and now the historical mainstay of Northern White and Hickory sands is now being replaced with “in-basin” or “regional” sand. The regional sand deposits ultimately consist of 100-mesh – a product that was originally a waste product in sand mines and utilized in small amounts in conventional wells for fluid loss purposes.
With the oversupply straining prices, both traditional and regional mines are subjected to idling and closures, even though the hydraulic fracturing industry continues to pump more volumes of proppant than at any other time in history. In 2018, proppant demand was, again, the highest on record. According to the KELRIK PropTester Proppant Market Report, totals for the global proppant market, consisting of sand, ceramic and resin-coated proppants, reached 229.8 billion pounds in 2018, an increase of 62.03 billion pounds (+37.0%) compared to the estimated 2017 volumes, Fig.1. The majority of what was provided was 40/70 and 100-mesh frac sand, Fig. 2. Despite these factors, the industry is still experiencing closures and acquisitions within the traditional and regional facilities, Fig. 3, Table 1.


While these significant supply changes have created an unsettled environment for proppant suppliers, understanding the key factors behind the change can allow the industry to adapt. Several questions remain unanswered: Are there significant quality differences among the new frac sand deposits? What are the new drivers—operators, service companies, proppant companies or outside investors?
QUALITY CONSIDERATIONS
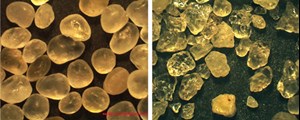
Is “sphericity” even a word? Is the industry moving from “good quality to “good enough?” To qualify sand as a proppant, the material is tested per API standards. Typical physical properties testing includes a sieve analysis, bulk density and specific gravity, roundness and sphericity, acid solubility, turbidity, and a crush strength test. Further performance testing includes long-term conductivity analysis. Traditional sands or premium frac sands from the Northern and Hickory (Central Texas) sand deposits rate highly in silica content, crush strength, roundness, and other tests, Fig. 4.

As the industry has shifted to quantity over quality and prefer close proximity to the wellsite due to logistical costs, various sources of regional mines have flooded the market. The quality of proppant that is now pumped ranges from high-quality to “fit-for-purpose” proppant that does not always meet API standards. It is often difficult for service companies and operators to differentiate the quality of these regional sand deposits. Recent studies have been implemented to study well productivity, EUR and other variables, to determine long-term effects on the well. Operators are now tasked with identifying a proppant suitable for specific well conditions, while avoiding the possibility of sacrificing quality and long-term well production.
MOVING FORWARD: KEY FACTORS?
It is not all bad news. The increased supply and lower material and completion costs have allowed the industry to better navigate through the cyclical and sometimes volatile world of oil and gas. Once overlooked, operators now further analyze proppants and have increased R&D efforts specifically regarding materials for unconventional wells. Studies include additional qualification, testing, research, and new product development for proppants and its associated fluids.
The studies allow for optimal products to be utilized in completion designs, taking into consideration the geology of the formation, current technology and budget restraints. It is important to note that ceramic, resin and specialty proppants are still being developed, despite the industry heavily favoring sand. Fracturing fluids and carrying agents are studied in conjunction, to investigate proppant transport, or the behavior of proppant and fluids inside a formation fracture. Primary goals for the industry are to connect microfractures and fissures to the secondary fractures and, ultimately, the wellbore.
Despite the abrupt changes, the proppant industry has proven its resiliency year after year, and will continue to respond to the operator’s needs. Whether it is demand surge, new deposits, quality considerations, logistics, or new product development, operators, service companies and proppant companies remain focused on the common goal of continued innovation to produce better wells for the oil and gas industry. WO
ACKNOWLEDGMENT
The Proppant Market Report (PMR) is compiled annually by PropTester, Inc. and KELRIK, LLC. The contributing authors have over 100 years of direct experience in the production, testing, sale and use of all types of proppants. For further information, please contact PropTester.
- When electric meets intelligence: Powering a new era in hydraulic fracturing (January 2024)
- Next-generation electric fracturing system improves efficiency, ESG performance (January 2024)
- Management issues- Dallas Fed: Activity sees modest growth; outlook improves, but cost increases continue (October 2023)
- What's new in production (August 2023)
- Mobile electric microgrids address power demands of high-intensity fracing (July 2023)
- Organic acids offer an alternative acidizing practice for production optimization (June 2023)
- Applying ultra-deep LWD resistivity technology successfully in a SAGD operation (May 2019)
- Adoption of wireless intelligent completions advances (May 2019)
- Majors double down as takeaway crunch eases (April 2019)
- What’s new in well logging and formation evaluation (April 2019)
- Qualification of a 20,000-psi subsea BOP: A collaborative approach (February 2019)
- ConocoPhillips’ Greg Leveille sees rapid trajectory of technical advancement continuing (February 2019)


