North Sea operators provide feedback on new marine seismic system
Offshore ReportNorth Sea operators provide feedback on new marine seismic systemBy improving signal fidelity and positioning accuracy, the new seismic system shows promise. In this report, three oil companies give their views of the system’s initial results in North Sea-field applicationsLeif Larsen, WesternGeco, London WesternGeco has devoted considerable resources to developing new techniques for acquiring what it considers the highest quality towed streamer marine seismic data possible. The result is a unique system, Q-Marine, the only single-sensor, towed streamer seismic system. Last summer, the company’s seismic vessel, Geco Topaz, deployed the new system on surveys for BP, Kerr-McGee and Statoil in the North Sea. Initial feedback from these operators is positive and strengthens the company’s faith in the system throughout its long development period. This article summarizes the underlying rationale for the system and shows comparative examples from the operators of last summer’s projects. Background Seismic techniques have advanced significantly over the last 20 years. The development of 3-D and then 4-D time-lapse surveys has been complemented by parallel improvements in data processing technology. Seismic data is now used at every stage of the E&P cycle, from initial exploration through life-extension of declining assets. Imaging for well placement, predicting pore pressure and monitoring fluid fronts require extremely accurate data. The goal is a high signal-to-noise ratio over an extended frequency range. Past emphasis has been on survey-design programs and data processing schemes that enhance the acquired signal bandwidth and amplitudes, while suppressing the accompanying noise. However, there is a limit to how much can be achieved by these means. About 10 years ago, the company decided to look more closely at the root cause of the noise problem. It felt that only by fundamentally reducing noise to its lowest possible level would seismic data be usable for reliable stratigraphic interpretation and time-lapse reservoir monitoring. Improving Data Quality ¾he company’s scientists and engineers used holistic analysis of data from existing acquisition systems, plus additional computer modeling, to conclude that the dominant noise sources were:
The new system addresses each of these issues. It uses calibrated sensors and sources as well as streamer steering to provide a step-change in data quality. Q-Marine can record signals from up to 80,000 individual hydrophones, requiring data rates in excess of 20 megabytes per second, made possible by advances in electronics and fiber-optic networks. This very high channel, single-sensor capability not only ensures that the seismic wavefield can be unambiguously constructed, but also properly records the noise, which can then be attenuated using adaptive software techniques – which are much more effective than the crude analog methods of conventional systems. The new process also features a calibrated marine source system, proprietary "Q-Fin" streamer steering devices and a fully braced acoustic network that provides in-sea equipment with an absolute 3-m positioning accuracy. These systems enable positioning and source characteristics to be repeated between phases of a 4-D "time-lapse" survey. This makes it a powerful tool for reservoir management tasks, such as: mapping of fluid movement and the OWC; tracking pore-fluid saturation changes; identifying bypassed oil and in-fill drilling opportunities; application of quantitative spatial constraints to the reservoir model; identification of flow units and flow barriers; and monitoring the performance of enhanced recovery programs. BP’s Magnus Field The system was offered to North Sea operators on a commercial basis for the first time in summer 2001. BP used it on a 280-km2 survey around Magnus field during May and June. Alan MacGregor, senior geophysicist for BP’s East of Shetlands area, described the purpose of the survey: "Recovery from Magnus, which has been in production for about 20 years, is already more than 60%. However, we believe this can be improved. Fluid flow in the Magnus reservoir is more complicated than initially thought. There are barriers and compartments in the reservoir that are not being fully drained by the inflow of water and are not visible from conventional seismic data. It is believed they are caused by faults and, in some cases, stratigraphic pinch-outs. We wanted to improve the vertical resolution to map where the fluids are and, hence, infer the location of the barriers. Our goal is to be able to position new wells in the optimal high points – in the ‘attics,’ if you like – to drain the trapped oil from these compartments."
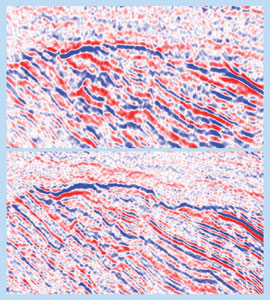
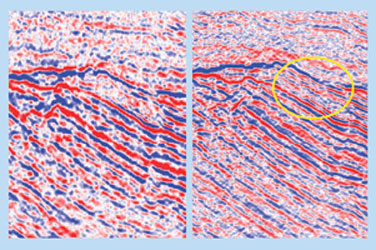
BP plans to use the new survey data in two ways. First, to compare the data with that from an earlier 1992 survey. Second, because BP is about to start injecting gas from its West of Shetland fields, the data will act as a baseline for future (time lapse) surveys that will hopefully reveal how gas moves through the reservoir. MacGregor chose the new system, in part, for its ability to control and navigate streamers behind the vessel, enabling data to be "put in the right bin," as he explained it. He was also interested in the system’s potential to reduce noise. "Because, in theory, there is less noise from swell and wave action, we hoped to tow the streamers shallower than previously and so achieve better resolution," he said. After quickly overcoming one or two operational "teething problems," it proved possible to tow streamers at a 6-m depth, compared with 10 m for the earlier survey. MacGregor was pleased with the attention paid to safety and environmental issues during the survey. "BP operates to the very highest HSE standards in the North Sea, and we expect the people we work with to follow suit," he said. Initial indications are that the data has a greater bandwidth when compared to a conventional survey. "We would usually expect to see data in the 6 – 50 Hz region," MacGregor said. "With this survey, we believe we have obtained more high-frequency information without losing the lower frequencies. One of our analyses shows a mid-point frequency of about 28 Hz, against the 21 Hz we would normally achieve with conventional seismic-acquisition techniques. It’s encouraging. We are carrying out quality-control checks on the data before stacking it; only then will we know how visible this improvement is." Kerr-Mcgee’s Murchison Field Kerr-McGee had very similar objectives to BP when using the new system to acquire a 3-D survey over its Murchison field: It wanted to acquire higher frequency data than contained in existing data sets. Glenn Morton, manager of subsurface technology for Kerr-McGee, said, "We wanted higher resolution so that we could see the stratigraphy in greater detail. Our aim was to get a better handle on faulting in the reservoir, to see more of the intra-Brent formation and map the individual beds within the Brent. "Seismic reprocessing of old data has not improved the frequency content. We were looking for systems capable of giving us significant amounts of energy in the 70 – 90 Hz range. The only one we thought had a chance was Q-Marine." The new system did better than Morton expected. Existing data had a peak frequency of about 22 Hz, which Morton was looking to raise to 40 Hz. What he got was a peak of about 50 Hz. His reaction was very positive. "In practical terms, all I could see with the old data was a tall skyscraper," he said. "Now, we can start to see some of the individual floors. It means that, in the future, we will have a better knowledge of what we are targeting; we will be able to manage production more effectively and place wells more intelligently to recover previously bypassed oil."
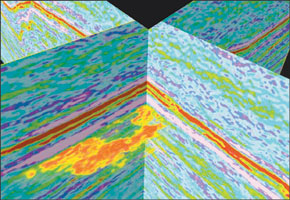
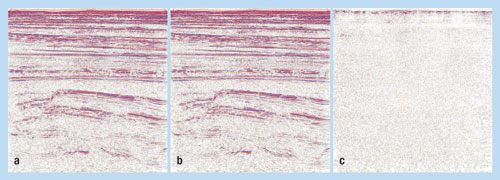
Statoil’s Interest Statoil research scientists in Norway have followed the development of the new acquisition system closely and were keen to see if it lived up to its promise. The opportunity came last summer when new surveys were acquired over the company’s Heidrun and Norne fields. The Heidrun-field objective was to gather 4-D data over a 60-km2 area for comparison with a survey carried out in 1986. Heidrun field is split into two main sectors by a TLP production facility in the center of the field. Production from the southern area is in decline, and Statoil wished to identify in-field drilling locations to extend the life of this part of the asset. Terje Dahl, chief geophysicist with Statoil, was pleased with the outcome of the survey. "Technically, it was a success," he said. "We have established potential drilling locations. We now hope that we will soon be able to say we have a commercial success." The survey over Norne field covered a much larger area (320 km2) and extended into neighboring Svale and Falk fields. The aim was reservoir characterization, and Statoil intends to use the data as a high-quality baseline for future 4-D work in these fields. In addition, a high-resolution re-shoot was carried out over 40 km2 of Norne field to provide data for comparison with a 1992 baseline survey. Dahl reports that this exercise has "shown how the oil-water contact has moved" and that the survey again "constitutes a technical success." In line with Statoil policy, Dahl declined to comment on the merits of the system relative to conventional seismic acquisition, at least as far as data quality is concerned. Dahl says, however, that he is "satisfied with the performance of the system" and the survey objectives were achieved. The company is likely to use the system again for one important reason. Dahl points out that it was possible to steer the cables effectively and gather data very close to obstacles, particularly in the case of the production ship that is stationed in Norne field. "We obviously want to minimize the number of ‘holes’ in the data," he said. "In some cases, and our Gulfaks field is a good example, the number of structures present in the field means we cannot image a significant fraction of the reservoir. We are very interested in the new technology for its ability in this respect alone. We would like to see continued improvement in the steering capability of the system." Looking Forward Initial feedback is sufficiently encouraging that three additional vessels have been equipped with the new system. These early results have more than met WesternGeco’s expectations in terms of data quality and repeatability. The company believes that the imaging power and resolution of the new system will quickly prove its worth to the industry. The steered-streamer, point-receiver, calibrated-source technique opens the door to various high-end processing possibilities. The company is actively working on a seabed system and is looking at the potential of the system to tackle a long-standing problem in marine seismic-data acquisition: the elimination of multiple echoes. Success in this area represents the next major goal in seismic imaging technology. Acknowledgment The author thanks Statoil and its partners Conoco and Fortum on Norway PL095 for allowing its input and use of comparative images; BP for allowing its feedback and use of comparative data from Magnus field; and Kerr-McGee for its contribution. Q-marine is a registered trademark of WesternGeco.
|
|||||||||||||||||||

- Quantum computing and subsurface prediction (January 2024)
- Mixed outlook for activity on the UK Continental Shelf (December 2023)
- Machine learning-assisted induced seismicity characterization of the Ellenburger formation, Midland basin (August 2023)
- What's new in exploration (March 2023)
- Seismic and its contribution to the energy transition (January 2023)
- First Oil: Sorting through the muddled mess (November 2022)
- Applying ultra-deep LWD resistivity technology successfully in a SAGD operation (May 2019)
- Adoption of wireless intelligent completions advances (May 2019)
- Majors double down as takeaway crunch eases (April 2019)
- What’s new in well logging and formation evaluation (April 2019)
- Qualification of a 20,000-psi subsea BOP: A collaborative approach (February 2019)
- ConocoPhillips’ Greg Leveille sees rapid trajectory of technical advancement continuing (February 2019)

