Shaletech: Improving unconventional reservoir performance with geoscience-based development strategies
Over the past several years, the shale industry has successfully lowered costs through improved drilling and completion efficiencies. Meanwhile, reservoir geoscience applications, which can further optimize operations, have not received the same level of focus. Incremental costs associated with reservoir data acquisition and time required for interpretation are often perceived as counterculture to the dominant cost-efficiency mindset. On the contrary, as operating efficiency approaches a plateau, refocusing on geoscience presents exactly the opportunity that unconventional operators need to further reduce total cost per barrel.
By leveraging fit-for-purpose measurements that are acquired at key points during the unconventional project life cycle and coupling them with efficient workflows that render acquired subsurface data timely and useful for operational decisions, operators can achieve several key objectives. One of these includes landing laterals with improved placement to unlock maximum producible hydrocarbons.
At the start of the project, acreage is typically selected, leased and ranked for potential, based on legacy well logs, nearby production information, and possibly seismic, if available. The vertical section of the first well drilled provides a critical opportunity to deploy the right modern technology to answer the following make-or-break questions:
• Are the hydrocarbons economically producible?
• What is the optimum landing point for laterals?
• What is an appropriate well spacing?
When selecting a landing zone, the obvious question is, where is the best reservoir? A strategy subscribed by many operators is simply to find it and land in the middle. While this is not without success, a growing body of experience demonstrates that operators can produce more by taking formation mechanical properties into consideration simultaneously. The goal thus evolves to land at the precise point that will initiate a hydraulic fracture having geometry to maximize contact with the productive reservoir. A further evolution in thinking is to make geology an integral part of the decision—will target properties be the same at the end of a two-mile lateral? Or even 500 feet away?
To answer the simple question of how much hydrocarbons are there, one must revisit accurate evaluation of unconventional reservoir quality, where legacy conventional measurements struggle. A decade ago, enormous quantities of core and long experience in the play were absolute requirements—but why? Unconventional rocks are highly complex and have many components that petrophysicists need to quantify and understand, Fig. 1. Fortunately, a renaissance in unconventional logging has seen the introduction of a range of new measurements, each directly sensitive to different key components of unconventional formations. What we used to infer through complex methods and subjective tweaking, we now measure directly. This enables addressing more relevant questions, such as, how much hydrocarbon is producible?
In addition to hydrocarbon volume, key controls on unconventional reservoir quality include kerogen type, maturity, volume, hydrocarbon type, mineralogy and clay volume, porosity, and permeability. The following looks at how each of these is evaluated.
Complex mineralogy. Porosity is low in unconventional reservoirs, so one or two porosity units of inaccuracy can defeat reservoir quality assessment. Key to accurate porosity determination is strong control over the mineral volumes in the rock matrix. Core measurements play an important role to identify the minerals to include in the formation model. Multiple independent measurements are required to resolve complex mineralogy; today this analysis is routine, as an advanced neutron-induced-gamma spectroscopy log provides direct quantification of the 18 most common elements present in sedimentary rocks. Porosity estimated from neutron and density logs after correcting for mineral composition, an important interpretation step, is still not equal to true porosity, as it includes solid kerogen volume fraction. An additional step will be necessary to account for kerogen.
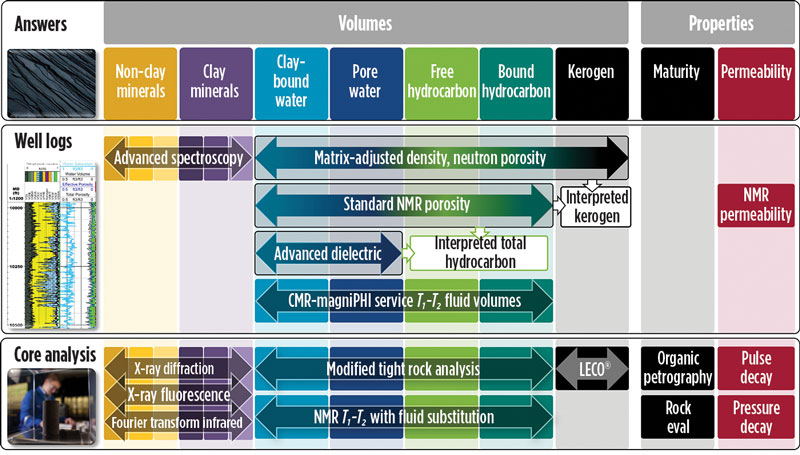
Kerogen and porosity. Characterizing kerogen is a critical step, but it cannot be achieved with conventional logs alone, which “see” kerogen as part of the porosity, as explained above. Direct measurement of total organic carbon (TOC) from the advanced spectroscopy log is a game-changer, enabling straightforward kerogen quantification in gas shales. In oil shales, determination of kerogen volume is made by subtracting nuclear magnetic resonance (NMR) porosity, which does not include solid kerogen fraction, from matrix-adjusted density porosity, as described above. Matrix-adjusted density porosity includes kerogen volume, Fig. 1. Refinements of the method account for the presence of bitumen and honor the kerogen density; these are strongly dependent on kerogen type and maturity. These properties are characterized in our laboratory via advanced organic petrography studies on core samples.
Movable vs. bound hydrocarbons. Kerogen is critical to generate hydrocarbons in oil source rocks, but too much can sometimes be a bad thing, since bitumen is also generated in-situ as a by-product, in proportion to the amount of kerogen and depending on maturity. A major failing of standard log interpretation is the inability to differentiate immovable bitumen from movable oil. This is resolved by the CMR-MagniPHI* high-definition NMR service—a new technology for quantifying movable and immovable hydrocarbons as separate volumes, in addition to potentially producible water volumes. Continuous NMR T1-T2 logs are advantageously complemented by core measurements to validate the interpretation of the T1-T2 maps for fluid identification. In our lab, similar NMR measurements are reproduced on rotary sidewall core (RSWC) samples in a native state, followed by measurements after oil injection and after water injection. This allows one to confidently assign different regions of the two-dimensional map to the respective fluid volumes.
Water volume and salinity. A direct means to measure formation water volume in shales is the application of another new technology: the multi-frequency di-electric dispersion log. It simplifies hydrocarbon volume determination in combination with porosity measurements, and is especially useful when drilling near parent wells, or in other situations where water salinity may be fresh or is unknown. In addition, formation chlorine concentration is a novel measurement extracted from analysis of the advanced neutron-induced-gamma spectroscopy log. It is intrinsically related to water salinity and water volume, and effectively complements the di-electric dispersion analysis. The insight on water salinity resulting from the integrated analysis of these two logs can be used further in saturation equations with deep resistivity measurements, if required.
Porosity and fluids, as determined by the volumetric model, are validated against modified TerraTek TRA* tight rock analysis service measurements, performed on crushed RSWCs. After void space is measured with gas porosimetry, two steps of heating expel pore water and mobile oil from the core. Solvent extraction is substituted for a third temperature step, quantifying soluble bitumen while avoiding overestimation of oil volume, due to unintentional cracking of kerogen.
Permeability is a very important reservoir quality criterion. It may be estimated via NMR logs; however, it is best calibrated via plug or crushed rock measurements performed on RSWCs.
Geomechanics. With reservoir quality thoroughly evaluated, the next step is to accurately predict hydraulic fracture geometry. This is complicated by the fact that nearly all shales exhibit layer anisotropy—essentially, properties measured in a vertical direction differ significantly from those measured in a horizontal direction. It is visually represented by the laminated nature of these formations. While past attempts have been made to explain shale behavior under stimulation with basic logs, in reality, the in-situ stresses coupled with the anisotropic mechanical properties of the rock exert control. It thus cannot be predicted from a simple gamma ray log, the rate of penetration, or even a standard compressional-and-shear sonic log. A conventional “one-dimensional” approach ignoring anisotropy risks to underestimate fracture breakdown, treating and closure pressures, and fails to anticipate potentially important fracture barriers in the target interval.
The first variable that needs to be defined, within the context of a high-resolution stratigraphic column, is which strata will fracture readily upon stimulation, and which strata will act as barriers to vertically contain the fracture. Typically, the former is associated with low minimum horizontal stress, while the latter is associated with high minimum horizontal stress. Subsequent goals are to predict fracture half-length, width and pinch points, and to understand the risk of fracture closure during production. Static mechanical properties, such as Young’s modulus and Poisson’s ratio—measured both vertically and horizontally—along with the principal stresses, must be quantified accurately in a continuous vertical profile to make these predictions.
An advanced multi-mode dipole acoustic log meets these requirements by interrogating the mechanical properties of the formation in three dimensions with four modes of acoustic wave propagation. The three principal stress magnitudes are estimated, and the maximum horizontal stress azimuth identified, providing the foundation for a 1D anisotropic mechanical earth model (MEM). There are several steps to calibrate the MEM, thus providing the ideal environment in which a wide range of hydrofracturing scenarios may be simulated. One example is performing multipath stress testing on RSWCs to give a more complete picture of formation stiffness and to calibrate interpretation of the advanced acoustic log. Drilling events and wellbore failures—breakouts and/or drilling-induced fractures—predicted by the MEM are validated against observation from microelectrical borehole images, and model parameters are tuned.
The next leap in model validation and tuning comes from in-situ measurement of actual pressure required to fracture specific intervals of rock. An advanced wireline formation tester suite enables performing a surgical microfrac by pressuring up a 3-ft interval straddled by inflatable dual packers. In doing so, the breakdown pressure is measured directly, and more importantly, the fracture closure pressure, or minimum horizontal stress. While similar in principle to a mini-falloff test, this technique has significant advantages, in that it is surgically depth-controlled and can efficiently test several intervals in a descent, including potential fracture barriers, as well as targets.
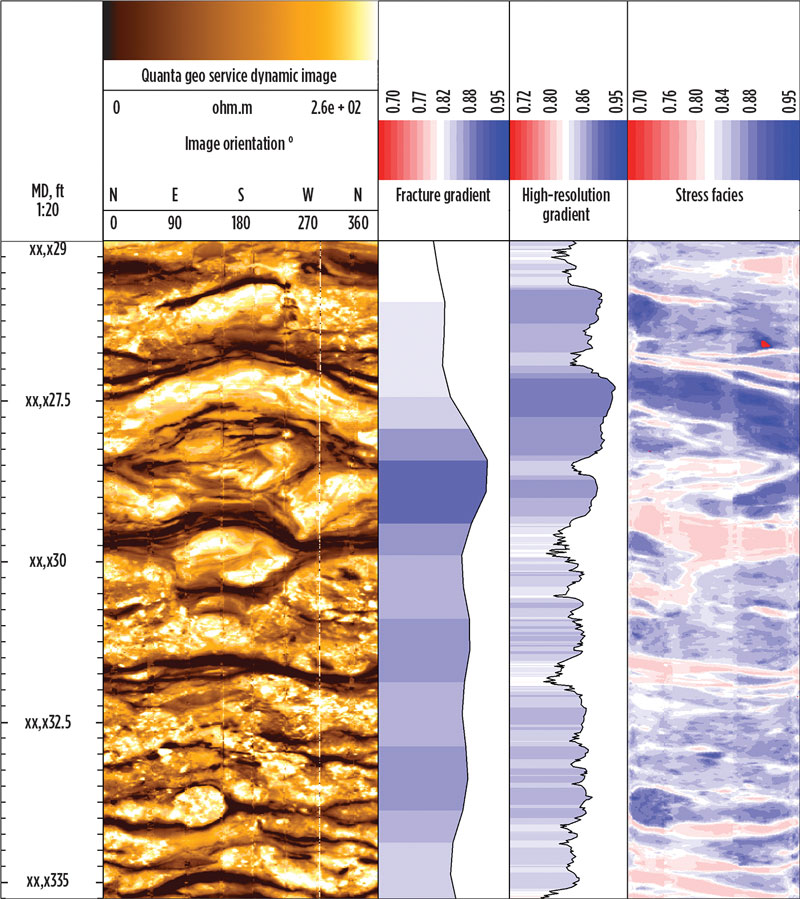
The thinly laminated nature of these reservoirs challenges the 2-ft vertical resolution of advanced acoustic logs, which measure bulk properties. Yet lab experiments and real-world observations demonstrate that high-resolution rock texture can exert strong control over fracture propagation. From borehole image texture, one can visually recognize varying mechanical facies, based on changes in lamination intensity or grain size. These interpretations are often borne out by the observed termination of a fracture at a textural boundary. By advantageously combining the 5-mm nominal resolution of the image with the acoustic mechanical properties, a sharpened, high-resolution minimum stress profile and image honoring these features can be produced, Fig. 2.
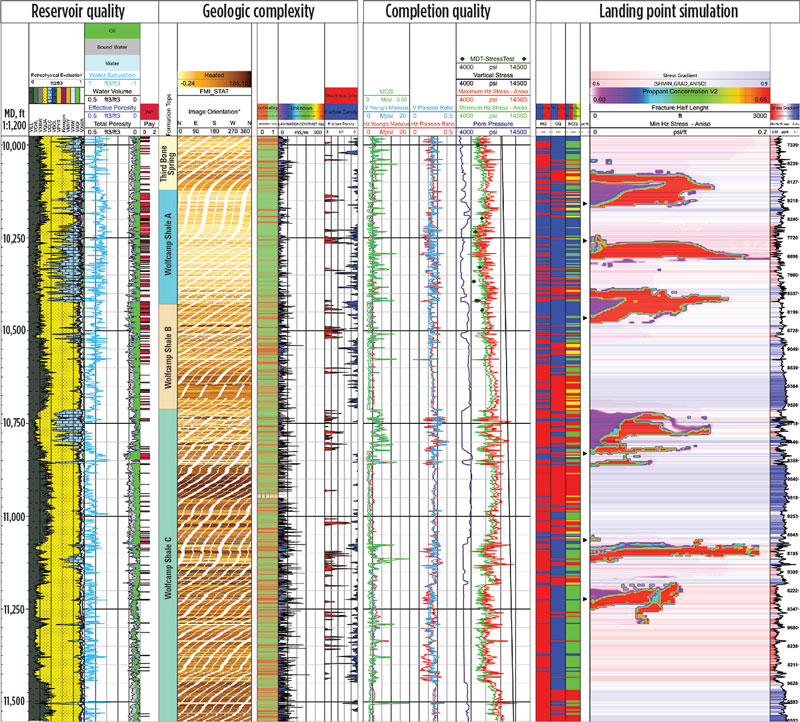
Multiple successive inch-scale laminations of highly contrasting mechanical properties can jog and eventually arrest fracture growth. A further enhancement to the workflow quantifies image lamination density and contrast, providing upscaled properties that can be input to hydraulic fracture simulation. A simple cutoff-based flag for intensely laminated zones aids selection of landing point candidates, Fig. 3, center left.
Geological complexity. When potential landing zones are identified, based on the favorable interplay of petrophysical and mechanical properties, it is important to also consider the likelihood that the zone will still be there at the end of a 2-mi lateral, or even 500 ft away from the present vertical wellbore. One must take into consideration the geologic complexity and depositional architecture of the prospective targets. Seismic data are useful to this end, but often not detailed enough to interpret the sedimentary facies and depositional sub-environment. While many facies may be laterally continuous in all directions, some are not continuous at all, while others may be continuous in a preferential direction related to the depositional trend.
High-definition microresistivity image logs provide a continuous, oriented photo-realistic image of the formations intersected by the well; a “virtual core” that can be interpreted visually. In addition to enabling facies interpretation, such images provide precise formation dip, and give a first glimpse of natural fractures, noting that sub-vertical fractures tend to be under-sampled in a vertical well (but can be evaluated well in laterals). The image interpretation provides the framework for a near-wellbore reservoir model, to populate with petrophysical and mechanical properties.
Landing point simulation. The final key to realizing maximum value from the unconventional evaluation workflow is the timely and efficient integration of petrophysical, geomechanical and geologic interpretations in a comprehensive, 3D reservoir modeling and simulation platform, where a fit-for-purpose hydraulic fracturing simulator enables operators to visualize the intersection of hydrofractures with potentially productive reservoir intervals. Prospective landing zones are identified initially as simulation candidates from cut-off-based flags, along with a facies log that summarize the overall, evaluated reservoir quality, completion quality, and geologic interpretation. For each eventual landing point, hydraulic fracturing is then simulated from a single perforation cluster, based on a specified pump schedule, using a mathematically rigorous planar 3D fracture model that honors reservoir complexity with a cell height of 1 to 3 ft. The explicitly modeled fracture length and height provide a first indication of appropriate well spacing for a given pumped volume, noting that in stacked pay scenarios that are increasingly common, spacing has become a 3D problem. Fracture width and proppant distribution are also important, as a “pinch point” may identify a scenario in which resources are spent to create apparently enormous surface area that quickly loses its hydraulic connection to the well, when flowback begins.
The workflow enables ranking the most prospective landing zones, as well as identifying those zones that should not be attempted. Ranking is based on the producible hydrocarbons contacted, or the workflow may be extended to include comparative production forecasts. Once a landing zone is selected, further simulations sensitize on landing at different points within. Key properties may change over short vertical distances in these finely laminated formations. In specific cases, moving 10 ft up or down can mitigate the impact of a pinch point, or even invert the dominant direction of fracture height growth.
CASE STUDY
A vertical pilot was drilled by a West Texas operator in the Delaware basin, to appraise the combined Wolfcamp-Bone Spring section that has thickness of over 1,800 ft, Fig. 3. NMR, spectroscopy, and dielectric logs were acquired, along with RSWCs to complement standard logs. Integrated interpretation favors the Wolfcamp A and upper Wolfcamp B sections for their oil pore volumes. A 1D anisotropic MEM was constructed from the advanced dipole sonic log, and calibrated by a published database of core measurements, by performing in-situ minifracs with the wireline formation tester at seven stations, and by wellbore failures seen in the borehole image. The image also identified geologically challenging intervals of directional channelized deposits and discontinuous slump deposits, as well as mechanically challenging intervals of high lamination.
Hydraulic fracture simulations (Fig. 3, right) shed light on various landing point candidates (black triangles). Visualizing frac geometry juxtaposed with oil volume and geologic interpretation gives a better understanding of potential outcomes. The combination of factors favors a landing in the Wolfcamp A, indicating a good fracture “fairway” that is free of pinch points and can be vertically contained, lying in continuous facies that have good oil saturation.
CONCLUSION
Multiple landing scenarios can, thus, be explored without spending the money to drill a single lateral, a sage alternative to the modus operandi of experimentation via the drilling of multiple, sparsely informed horizontal wells. As the shale industry weathers the downturn and makes strategic decisions to sustain increased market volatility moving forward, solutions such as this that consider the complexities of shale reservoirs will be increasingly valuable. A smartly rationed investment in the right subsurface data comes at a fraction of the cost of a single horizontal well, yet when applied at the right time, can vastly shorten the unconventional learning curve for the life of the project.
*Mark of Schlumberger
- What's new in production: When everything is going wrong at the same time (April)
- Op-Ed: American energy faces attacks by European activist courts (April)
- Drilling technology: Drill bit advances continue their relentless march forward (March)
- Integrating real-time drilling analytics to reduce carbon intensity and operational risk (March)
- Drilling advances: Gas: What’s a mother to do? (March)
- Regional Report: Brazil reaches for new heights in 2026 (March)
- Subsea technology- Corrosion monitoring: From failure to success (February 2024)
- Applying ultra-deep LWD resistivity technology successfully in a SAGD operation (May 2019)
- Adoption of wireless intelligent completions advances (May 2019)
- Majors double down as takeaway crunch eases (April 2019)
- What’s new in well logging and formation evaluation (April 2019)
- Qualification of a 20,000-psi subsea BOP: A collaborative approach (February 2019)

