Integrated geomechanical interpretation of hydraulic stimulation using distributed vibration sensing
In unconventional formations, attention is paid to the experiment well, or the first few trajectories drilled from a pad. Understanding derived from such wells provides the blueprint for large numbers of subsequent stimulation treatments. In recent years, there has been an interest in distributed measurements as an adjunct to the existing hydraulic fracture monitoring (HFM) workflow. Although at first a qualitative addition to real-time operational decisions, it has now become a tool for quantitatively assessing the flow into the reservoir.
In addition to distributed acoustic sensing (DAS) for flow allocation in treatment wells, and microseismic in monitoring wells, the distributed vibration sensing (DVS) systems have very broad-band response and can be used deep into the sub- 1Hz range of very low frequencies (VLF). Recent results indicate a response in monitoring wells that is sensitive to the fracturing process and consistent with induced strain. Although incomplete, laboratory tests, so far, seem to support this idea.
The design and interpretation of HFM, then, should incorporate all these aspects of fiber-recorded information. A review of the extension of existing workflows—used in planning and interpreting unconventional pads, which already provide the combination of complex fracture propagation with the geomechanical far-field response of the reservoir—will be presented. This drives the generation of geophysical synthetics, to aid microseismic monitoring design. Generating synthetic DVS responses across all frequency ranges, from VLF to microseismic and flow profiling, influences the design of the wellsite monitoring system.
THEORY/METHODS
We extend existing workflows used in designing and interpreting hydraulic fracture monitoring, to incorporate the new information from distributed acoustic sensing (DAS). The existing geomechanical approach provides the changes in effective stress and plastic strains that indicate the propensity for microseismic events to occur. Once we have identified regions and potential mechanisms of microseisms, we translate the geomechanical model into an anisotropic geophysical model and simulate example test events, using finite-difference methods. The same approach also estimates the time-lapse vertical seismic profile (VSP) response, another way that DAS has been used in the field.
This approach incorporates pump schedule design and microseismic response. The fracture simulators already capture details, such as perforation erosion and interaction with far-field natural fractures, so that the forward modelling of the expected flow allocation can be provided for comparison to the DVS response in real time.
The very low frequency (VLF) response at the monitoring well, on the other hand, is not captured in the original workflow. The VLF response is indicative of changes in temperature and in strain along the fiber. Currently, we treat these separately. The extension to warm-back simulation for distributed temperature sensing (DTS) analysis has been reported elsewhere. In our approach, we incorporate both the injection and flowback temperature changes by first modelling the fracture propagation with the fracture model. We then construct a thermal reservoir simulation model. We use it to model the injection and subsequent flowback, including the temperature changes occurring as the frac fluid is loaded with sand. This approach can also be used for planning distributed temperature sensing (DTS).
The strain changes along the fiber in an offset monitoring well during fracturing and shut-in are modelled in a stepwise manner. We split the pump schedule into ten sections and capture the placed fracture and its internal pressure at each of these time sections. The far-field geomechanical response is then computed as the change in strain from one placed fracture state to the next. The resulting strain responses are considered indicative of the expected fracture position for each given cumulative injected volume. In this way, if the fractures for a given stage are propagating asymmetrically, this will be indicated by a difference in the expected response as being either early or late, compared to the simulated responses.
To provide support for distributed vibration sensing, we also need a fast approach to generating raw optical backscatter from geophysical, geomechanical and temperature simulations. The simulator combines a noise-free map in time and space of the perturbations occurring to the fiber (i.e. the signal). A phase-shift map for the target fiber at rest is augmented by a linear phase shift map, based on the perturbations. An assumption is made that the fiber consists of effective scatterers that are, themselves, Bragg gratings with uncontrolled line spacing, introducing an additive source of phase noise.
Each effective scatterer has a random backscatter amplitude, which varies non-linearly with the perturbations. This assumption introduces a multiplicative source of phase noise. The scattering amplitude, then, is non-linearly related to the local displacement of scatterers, and changes in the scattering amplitude profile are permanent. Therefore, the backscattered amplitude profile from the fiber at rest is permanently altered from the initial amplitude profile. Conceptually, this corresponds to different physical explicit scatterers contributing to the observed effective scatter, when the fiber returns to rest. If the strain never changes, the effective scatterer profile is constant.
The interrogation light pulse is modeled as a Tukey window, with carrier noise, and is then convolved with the fiber. The resulting backscatter is heterodyned with a local oscillator model, mimicking the heterodyne distributed vibration sensor (hDVS) system.
This flexible approach provides for various operating principles of the interrogator-fiber system. The resulting synthetic data set contains the raw backscatter response and, so, can be processed using the same digital receiver that is deployed at the wellsite. This allows the fine-tuning of field processing parameters, such as the gauge-length and the real-time output spacing in time and depth.
Geomechanical modelling. We extend the approach taken in previous studies to capture the propagation of a fracture and the associated geophysical signatures from stimulation-induced changes in stresses and strains. This process is one-way coupled, in that the geometry of the propagating fracture is imposed as a pressurized slot in the geomechanical simulator to elicit the reservoir response. In the present version, that reservoir response does not then feed back into the fracture simulation (which would be two-way coupling). Another simplify-ing assumption made in the present work is that the wellbore does not act as a strain concentrator, and so the very low frequency (VLF response) is assumed as being the reservoir strain axially along the fiber.
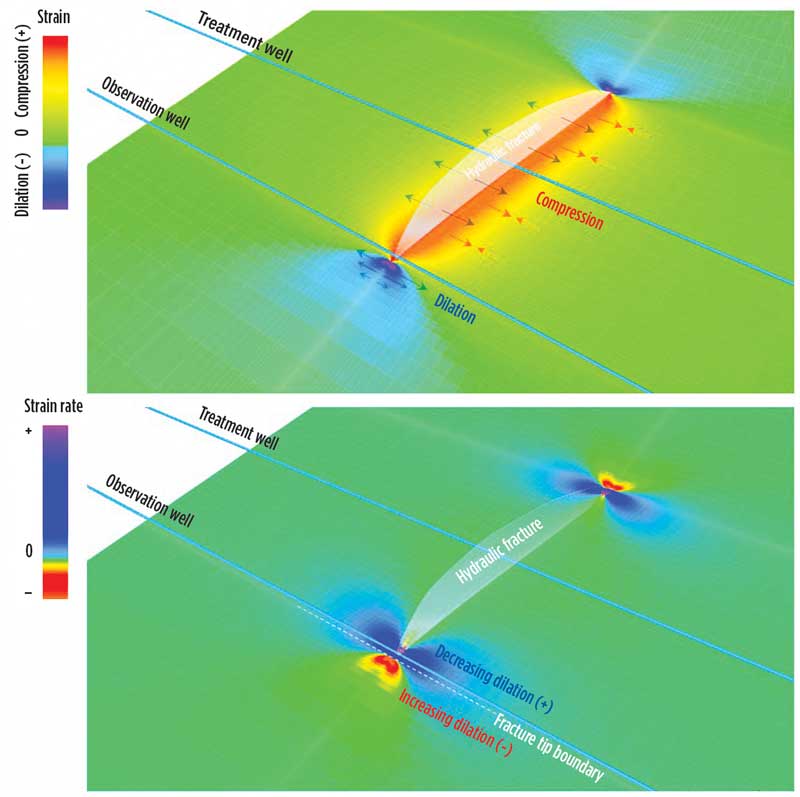
An example geometry is shown in Fig. 1, where the induced fracture was modelled as 10 separate propagation steps. The propagation was for a fixed height fracture, successively extending in 100 ft bi-wing lengths. The steps were designed to represent a frac-hit, where pumping is halted one step after this condition is achieved. Additional shut-in steps were modelled after the last propagation step as a depressurization of the slot with no change in geometry, although the analysis was limited to the frac-hit detection.
RESULTS
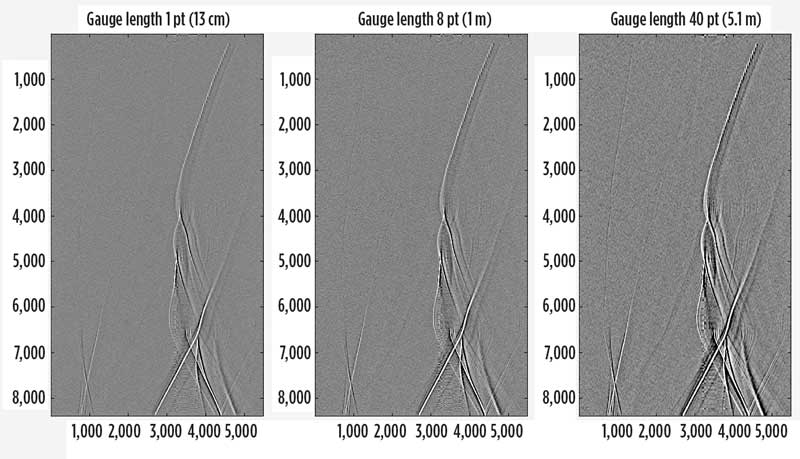
We consider a typical vertical velocity profile for an unconventional reservoir with a slower shale stacked between faster rocks. For a vertical monitoring array, we consider the response to a microseismic event and find that a longer gauge length provides more signal to interpret the event at shallower depths, Fig. 2. However, that also leads to a lower frequency content overall. In this way, we can design an appropriate scheme for maximizing real-time event detection.
In the standard workflow, we model only the placed fracture (pump-in state) and the settled fracture (shut-in state). This means that the fracture propagation for a complete stage can be simulated separately from the reservoir’s geomechanical response to that fracture. However, to understand the VLF response, we also model the pump-in as several steps. This captures the expected variation in VLF strain along the fiber, as the fracture propagates during pump-in and as the formation relaxes during shut-in and flowback.
The VLF strain is captured as the in-line strain along the wellbore trajectory through the incremental strain tensor calculated in the reservoir, Fig. 1a. Reviewing the VLF signal at the monitoring well, we find that if the fiber response to low-frequency strain is linear, there is a dramatic signal increase expected just ahead of a propagating fracture tip, Fig. 1b. The quantity of interest is the projection of the fracture-induced stain change along the axis of the fiber. The strain rate map, depicted in Fig. 2b, is the apparent low-frequency strain increment, as it would be perceived by the fiber, after rotating the global strain tensor to the fiber axis.
The creation of microseismic synthetics largely follows the finite-difference modelling workflow used for conventional borehole geophones. By simulating device-specific optical backscatter response, the synthetics can be used to determine the processing-chain that will provide fit-for-purpose performance. Figure 2 indicates that it is not necessarily appropriate to aim for maximum spatial resolution, when we are concerned with sensitivity across the full aperture to augment a borehole 3C array or for moment tensor inversion.
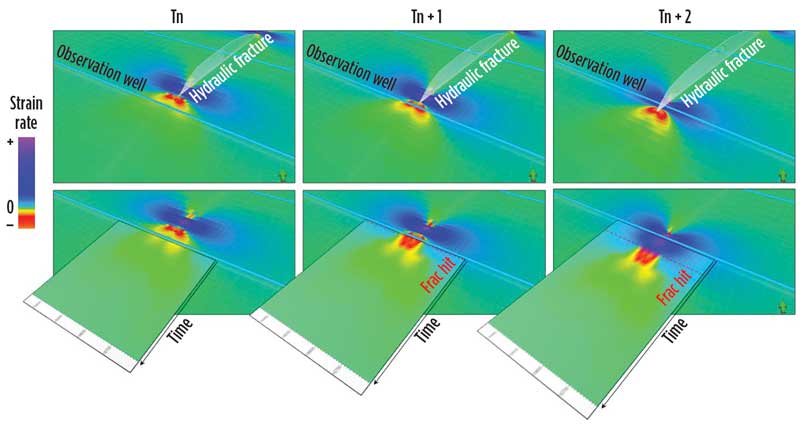
Our current modelling of the fracture propagation is a quantization of the process that we have previously employed to assess the propensity for microseismicity. This quantization introduces a calculation overhead. We currently consider a small number of steps (order 10 per pumped stage and 10 more for flowback) as sufficient to capture the expected signal. During real time, the simulated response is correct in sequence, and we can manipulate the time axis to remain synchronized with the real-time estimate of fracture propagation coming from the hydraulic fracturing team (i.e., total pumped volumes). In this way, anomalous propagation, and particularly the risk of frac-hits, can be monitored. Figure 3 shows a typical real-time realization of the VLF strain-rate synthetic for the horizontal monitoring well.
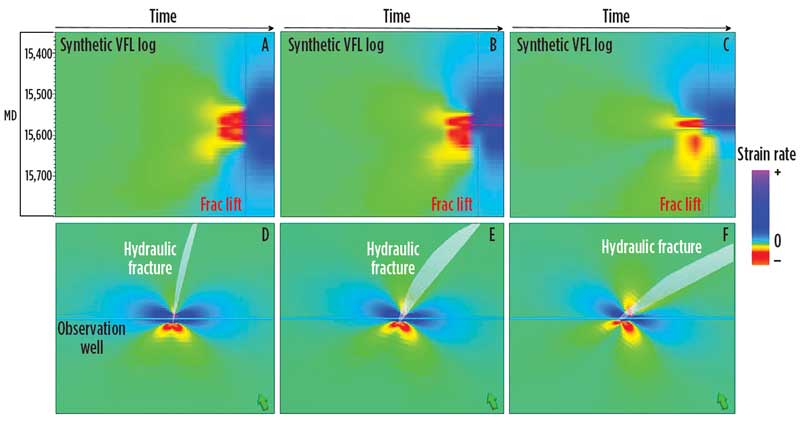
We note that, for our modelled VLF data, the separation of the peaks, when observing the absolute VLF strain-rate, is related to the distance of the fracture tip from the monitoring well, Fig. 4a. Under the assumption that the pressure in the fracture during propagation is equal to the minimum horizontal stress, the ratio of the peak recorded during pump-in to the value at shut-in, could provide an additional estimate of instantaneous shut-in pressure (ISIP). We are currently reviewing field observations to further investigate ways in which the observed VLF quantitatively recovers the low-frequency strains.
Synthetic VLF response modelling can also generate signature templates for different fracture propagation scenarios. As can be observed in Fig. 4, the expected frac hit signature changes depending on the hydraulic fracture propagation direction with respect to the wellbore trajectory. Multiple scenarios can be modelled to span uncertainties in in-situ stress directionality and/or the possible hydraulic fracture reorientation due to, for example, the presence of natural fractures and sub-seismic faults. Such templates can be useful to resolve hydraulic fracture characteristics based on the post-job interpretation of the VLF data, especially when combined with additional data sources like microseismic.
CONCLUSIONS
Now that distributed vibration sensing is becoming a standard tool for hydraulic fracture monitoring (HFM), there has been a need to extend the HFM planning and interpretation workflows to incorporate this rich ultra-broadband measurement. We have described an extension to the existing HFM planning and interpretation workflows that addresses this need. We find it necessary to capture the far-field response of fracturing during fracture propagation to support the use of ultra-low frequency data. Once pre-modelled, the strain steps show expected order of response, but not specific timing, and the fracture propagation can be matched during real-time to estimate the fracture propagation extent.
ACKNOWLEDGEMENT
This article contains elements from URTeC paper 184, presented in Denver, Colo., 2019.
- From post-mortem to real-time: A scalable approach to fracture diagnostics (May)
- The benefits of Simulfracs (January)
- Molecular fracing: A rock-focused, field-ready stimulation chemistry (January)
- Halliburton’s ZEUS IQ™ powers the first fully autonomous fracturing platform with closed-loop automation (January)
- Flexibility and modularity enable tailored solutions for challenging shale plays (December 2025)
- Making shale competitive (December 2025)
- Subsea technology- Corrosion monitoring: From failure to success (February 2024)
- Applying ultra-deep LWD resistivity technology successfully in a SAGD operation (May 2019)
- Adoption of wireless intelligent completions advances (May 2019)
- Majors double down as takeaway crunch eases (April 2019)
- What’s new in well logging and formation evaluation (April 2019)
- Qualification of a 20,000-psi subsea BOP: A collaborative approach (February 2019)

