“From scratch” frac re-design yields uplift in legacy Bakken field
In the pursuit of improved production results, Abraxas Petroleum spent the slow months of the recent industry downturn re-designing its Bakken completion strategy. With the rapid influx of new technologies into the completion marketplace, it was an opportune time to set aside an older design and take a look at new options. This was challenging, because our legacy design had proven effective, yielding production results ranking in the top 10% among area peers. Nevertheless, a basket of fresh technologies was analyzed from scratch.
Our goal was not simply to improve production results but more to increase full-well rate-of-return (ROR). Generating improved production results is an important part of the equation, but no more so than cost control. A myopic focus on production uplift can be counterproductive, if the cost of uplift is not kept in perspective. In our work, any “improved” design must offer a production/cost balance that results in increased ROR.
The primary analytical method applied in this process was production results data mining, employing both bi-variate and multi-variate correlations. This method, which is well-documented in the literature, allows for the direct investigation of the relative benefits of particular design changes by measuring their effect on well productivity versus legacy cases.1,2 We attempted to isolate each of the targeted technologies into particular well groupings, so that performance differences could be analyzed.
This re-design resulted in a significantly revised completion approach that has now been applied with encouraging results in a six-well zipper project in McKenzie County, N.D. The re-design process and its application are described below.
PROJECT AREA / WELL DESIGN
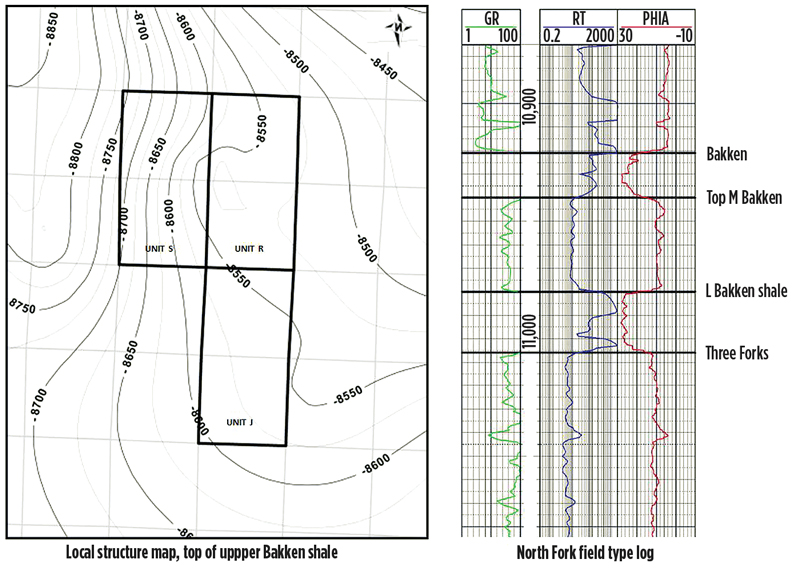
The subject reservoirs in this analysis are the Middle Bakken and Three Forks intervals (together, known as the “Bakken system”) in east-central McKenzie County, N.D. The history of the development of the Bakken system is well-documented.3,4 Figure 1 shows the local structure on top of the Upper Bakken shale, along with a type log displaying local stratigraphy. Our wells are spaced 660 ft between wells in the same zone, and are completed with the same stimulation design, regardless of reservoir. All wells have 10,000-ft lateral lengths and are drilled on a north-south orientation. TVD is approximately 11,500 ft. All wells have uncemented liners with swell packers for stage isolation. The six wells targeted for our new design each had eight toe-ward sleeve stages, followed by 33 perf-and-plug stages. The eight sleeves were included in the well design, to eliminate the need to drill out at depth.
LEGACY FRAC DESIGN
Our legacy design was a cross-link-heavy, hybrid fluid system, with relatively high average proppant concentration (1.8 ppg, 6.0 ppg, max), large mesh sizes, and a ceramic tail. This design was driven by the concept that the creation of near-wellbore conductivity is important in avoiding flow convergence problems in horizontal wells. Pump rates were typically limited to 35 bpm, to restrain vertical growth. At these rates, cross-link gels were needed to transport higher prop concentrations.
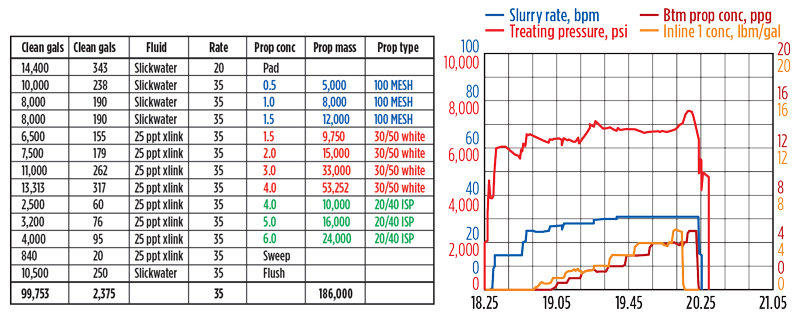
Figure 2 shows a representative pump schedule and treating chart. The chart shows typical features of this design, such as the ball seat at 18:42, followed by formation breakdown and then the cross link-induced friction hump at 19:20.
THE RE-DESIGN PROCESS
Our first step in re-designing was to identify the strategies and technologies that we felt had the best chance of impacting our results. Listed below are the items that we considered in our analysis:
- High-energy stimulation—use of larger quantities of fluid and sand, sometimes at higher injection rates. Average proppant concentration can increase or decrease in these designs, depending on whether the emphasis is on increasing fluid volumes or proppant mass. Our design changes generally fit within this category.
- Slickwater stimulation—utilizes slickwater only, normally at high pump rates and very low average proppant concentration (< 1.0). This can be a very high-energy method, but it sacrifices any attempt to provide higher near-wellbore conductivity.
- Higher proppant mass—increased proppant usage on a lbs/ft basis has become very common in conventional and high-energy designs.
- High-concentration friction reducer (HCFR)—utilizes a viscosified FR system to replace cross-linked gel in slurries carrying higher proppant concentrations. This was selected as our primary fluid, replacing cross-linked gel. See discussion below.
- Self-suspending proppant—this is a proppant coated with a polyacrylamide product that viscosifies with the addition of water. While this technology appears to have merit, the additional expense was not deemed justifiable at this point.5,6
- Ceramic vs. white sand—our legacy design utilized ceramic, but we reviewed this factor, since it is such a significant cost delta. While we found a small positive correlation with ceramic usage, the additional expense was not deemed justifiable.
- The use of particulate diverters to increase cluster efficiency. See discussion below
PRODUCTION DATA MINING
In data mining, the simplest approach is the development of bi-variate correlations between individual completion design variables, like total proppant usage, and production results. Figure 3 shows an example of a bi-variate correlation panel for a particular data set, typical of those generated in this project. The relationships between proppant and fluid usage versus results are often quite clear in these correlations, generally showing production uplift with increased material usage.
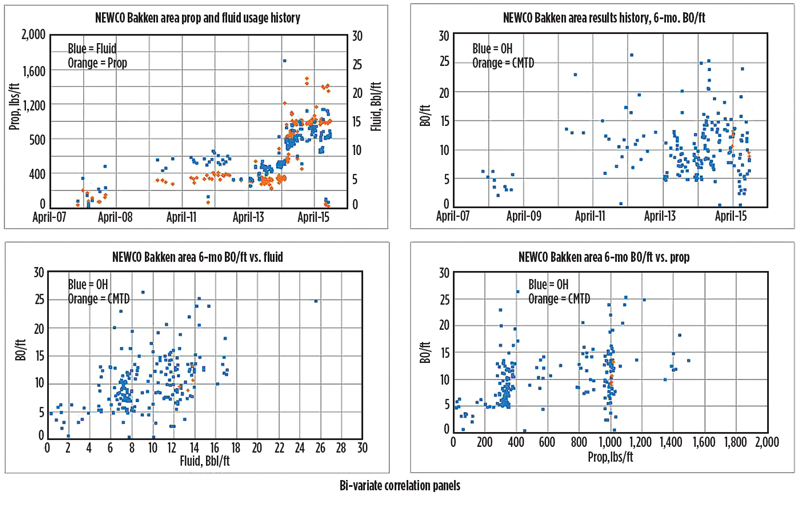
Material usage versus time plots are also utilized to identify current trends in the play. The correlations in these particular panels show: 1) increasing proppant and fluid usage trend by one particular operator; 2) relatively few recent cemented completions; and 3) probable uplift in production, with increased fluid and proppant usage per lateral foot.
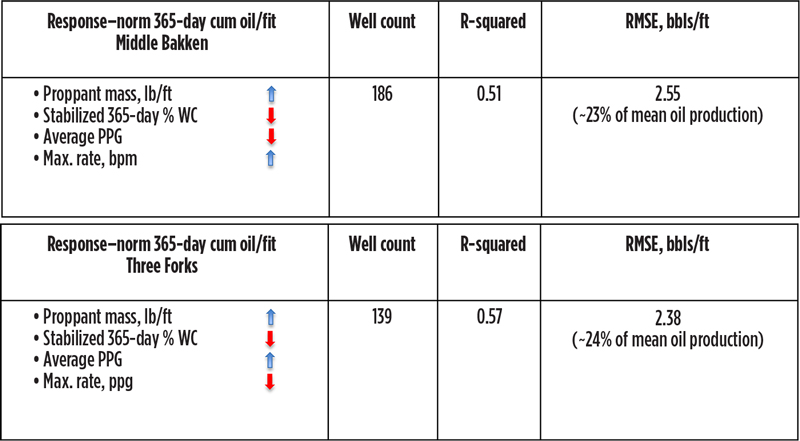
Multi-variate analysis, as the name implies, considers the interactive effect of multiple variables at once, potentially leading to stronger correlative indicators. Our multi-variate analysis of 186 local wells produced correlative indicators similar to those yielded by our bi-variate studies. For both the Middle Bakken and Three Forks reservoirs, proppant mass per lateral foot, average proppant concentration, and pump rate all showed strong correlation with production results. Proppant mass per lateral foot correlates positively, meaning that higher lbs/ft will achieve better production in both formations. Average proppant concentration correlates negatively, which equates to treatments with larger water volumes performing better. Pump rate correlates positively—higher rates can promote a better completion.
In the Middle Bakken and Three Forks, correlations indicated that increasing proppant mass could increase oil production in one year by about 30%, at an estimated 1.4% increase in well cost. Likewise, increasing fluid usage (lowering average ppa) showed the potential to uplift production 17% in the Middle Bakken and 13% in the Three Forks. Shown in Table 1 are the multi-variate indicators. Blue arrows indicate positive production correlation with increases, and red arrows show decreases.
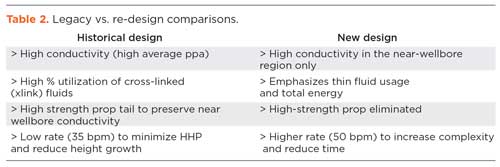
DESIGN CHANGES
As a result of these studies, several significant changes were made to the legacy design. Table 2 contrasts the old and new designs. Both the bi-variate and multi-variate studies indicated that a higher energy treatment, with a lower average proppant concentration, would be beneficial. So, we increased total fluid usage and pump rate 30% and proppant usage 11%. Average proppant concentration decreased from 1.80 ppa to 1.25 ppa. While the overall, average proppant concentration was decreased, higher concentrations (5.0 ppa) were still included at the end of the pump schedule, to improve conductivity in the near-wellbore region.
High-concentration friction reducer (HCFR) was selected as the viscosifier for the higher-ppa sections, replacing cross-linked guar gel. Use of HCFR is relatively new, and, therefore, difficult to evaluate using public data, but its successful use has been cited in the literature.7 While it does not match cross-linked fluids in terms of absolute viscosity and proppant carrying capacity, its advantages are lower cost and potentially lower residual damage (ibid). While there was an increased screen-out risk associated with the use of this fluid, the cost benefits made the attempt worthwhile.
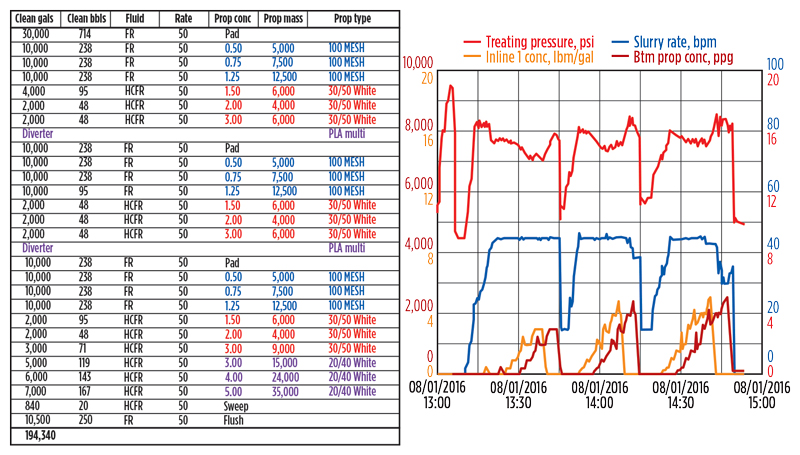
We also elected to employ granular polylactic acid (PLA) as a diverting agent in our stages, dividing each stage into three sand ramps with inter-ramp diverter drops. While there is published evidence of diverter effectiveness in cemented applications, similar support was not found for its use in open-hole environments.8 However, we were aware of anecdotal evidence of open-hole effectiveness, and we decided that the low incremental cost of diverter use made experimentation acceptable. Figure 4 shows a typical pump schedule and treating plot for the new design. Diverter effectiveness is evidenced by the pressure increases noted, when the diverter arrives on zone, and also by the general pressure increases in each successive ramp.
IMPLEMENTATION OF THE NEW DESIGN
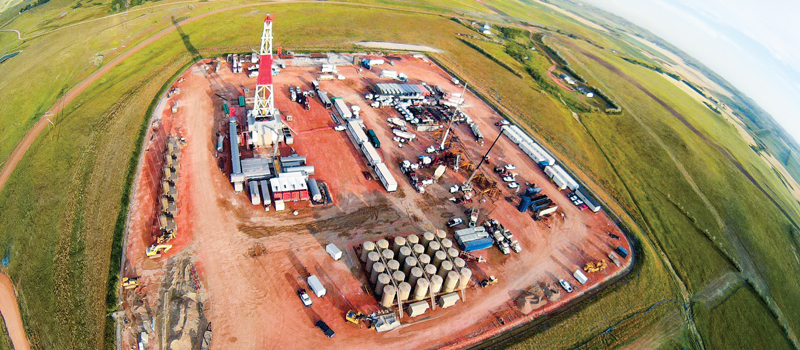
A six-well group on a single pad in North Fork field was selected for implementing the new design. This well group (referred to as “Super 6,” owing to their location on our 10-well “Super Pad”) is the latest of 28 producers drilled on our North Fork acreage since 2010. The Super 6 wells were drilled in 2015, but they were left as “drilled but uncompleted” until August 2016, when completion with the new design began.
We deployed the new design in graduated fashion—the first eight stages in each well were similar to our legacy design, using cross-linked fluid to carry the heaviest proppant concentrations in an un-diverted schedule. This was to avoid screen-outs during the toe-ward sleeve stages, where inability to flow back could necessitate a drill-out. Following the sleeves, we implemented diverted HCFR schedules, first in two-ramp and then in three-ramp designs. In some cases, particularly following screen-outs, we reverted to conservative schedules; otherwise, we pumped some form of the diverted HCFR design. The exception was the 15H well, nearest the legacy producers lying to the east. DFIT analysis had revealed depletion in this well, so the stage design remained weighted toward cross-linked fluid, to facilitate placement in the lower-pressure environment.
SCREEN-OUT FREQUENCY
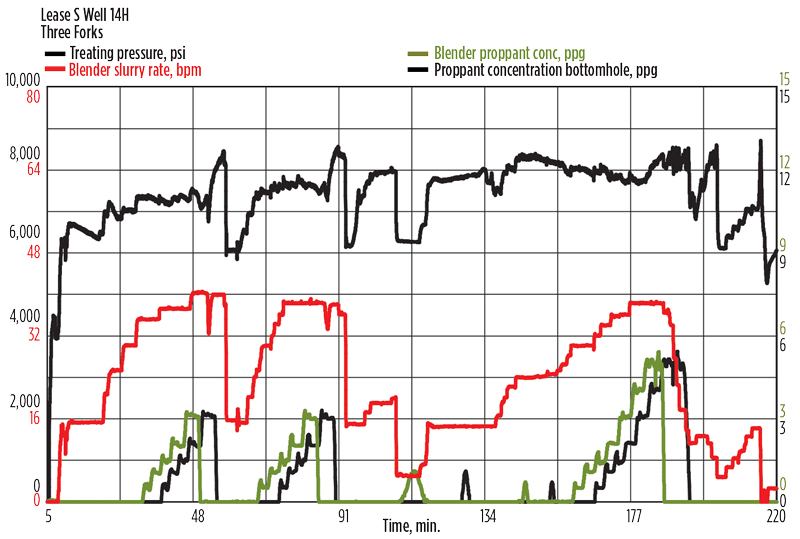
Screen-out frequency did increase in the Super 6 wells, compared to the legacy North Fork wells, Table 3. Of the 24 screen-out events on the Super 6, ten were related to diverter activity. The treating chart in Fig. 5 shows an event of this kind, with a dramatic reaction to the second diverter drop. Drops sizes ranged from as little as 2 lbs of diverter per drop to 12 lbs per drop, and were usually tailored on the fly, depending on treating conditions in the given stage. There was indication of diversion on a high percentage of the drops, although the magnitude of the reaction was somewhat unpredictable.
There also were several late-stage screen-outs that appeared to be a reaction to high concentrations (4.0 to 5.0 ppa). We did not discern a clear relationship between these late-stage occurrences and fluid type, in as much as they happened in both cross-linked fluid and HCFR systems. While screen-outs are generally undesirable, it was possible to continue operations on neighboring zipper wells while screen-out remediation was performed, thereby minimizing downtime. So other than the cost of the additional gel required for post-flow back sweeps, there was little in the way of incremental costs associated with these events.
PRODUCTION AND ECONOMIC UPLIFT
The new design resulted in a 23% production uplift, compared to the modern legacy averages. Production results were evaluated using first 120-day metrics (the maximum available on the Super 6 wells at the time of writing). The production graph shown as Fig. 6 compares the Super 6 well group performance (green) to all North Fork legacy producers (blue) and also a subset of the legacy wells representing more modern completion styles (red). The progressive uplift between the groups represents learning and improved execution over time, i.e. optimization. The production values plotted are normalized averages for each group.
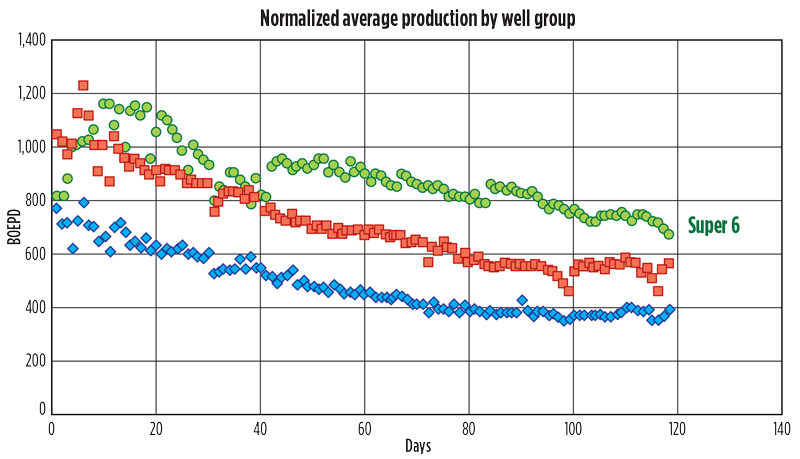
The averaging does not discriminate between Middle Bakken and Three Forks wells. Experience has shown that the two reservoirs perform similarly in this area, with perhaps a slight bias toward Middle Bakken wells. As the legacy well group averages are weighted toward the Middle Bakken (15 out of 22) versus the Super 6 (3 and 3), the Super 6 average may be slightly handicapped on a relative basis.
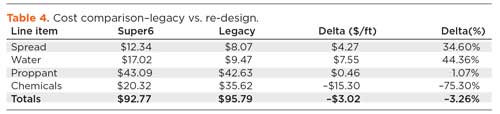
The new design also proved to be 3.6% less expensive than the legacy design, Table 4. This was despite the new design utilizing more horsepower and material. The most significant difference was the savings associated with the replacement of gel with HCFR. These values represent the standard design for each case, and are normalized on a per lateral foot basis.
Economic cases comparing the Super 6 results to the modern legacy average, run at NYMEX strip pricing, indicate an increase in full-well rate-of-return from 53.8% to 75.6%. While absolute RORs are sensitive to total capital, price deck, and other financial parameters, the relative ROR uplift (+/– 40%) is fairly consistent, regardless of the economic model selected.
CONCLUSIONS
A new completion design resulted in a 23% production uplift, at a reduced cost, yielding a full-well relative ROR increase of 40%. The HCFR proved to be an effective fracturing fluid, capable of carrying proppant loads as high as 5.0 ppa, at a cost significantly lower than cross-linked guar gel.
PLA granular diverter was highly effective in an open-hole environment, based on treating pressure evidence. The positive results in this project show that the careful study of public data can be a very effective optimization method. ![]()
REFERENCES
- Lafollette, R.., W. D. Holcomb, and J. Arajon, “Practical data mining: analysis of Barnett shale production results with emphasis on well completion and fracture stimulation,” SPE paper 152531, 2012; http://dx.doi.org/10.2118/152531-MS.
- Lolon, E., K. Hamidieh, and L. Weijers, “Evaluating the relationship between well parameters and production using multivariate statistical models: A Middle Bakken and Three Forks case history,” SPE paper 179171-MS, presented at the SPE Hydraulic Fracturing Technology Conference, The Woodlands, Texas, Feb. 9–11, 2016.
- Besler, M. R., J. W. Steele, and T. Egan, “Improving well productivity and profitability in the Bakken: A summary of our experiences drilling, stimulating and operating horizontal wells,” SPE paper 110679, presented at the SPE Annual Technical Conference and Exhibition, Anaheim, Calif., Nov. 11–14, 2007.
- Wiley, C., B. Barree, and M. Eberhard, “Improved horizontal well stimulations in the Bakken formation, Williston Basin, Montana,” SPE paper 90697, presented at the SPE Annual Technical Conference and Exhibition, Houston, Texas, Sept. 26–29, 2004.
- Goldstein, B., and A. VanZeeland, “Self-suspending proppant transport technology increases stimulated reservoir volume, and reduces proppant pack and formation damage,” SPE paper 174867-MS, presented at the SPE Annual Technical Conference and Exhibition, Houston, Texas, Sept. 28–30, 2015.
- Parkham, R., B. Engebretson, S. McKenzie et al, “Completions evolution in Williston basin reduces fluid and chemical intensity, and increases production,” SPE paper 179111-MS, presented at the SPE Hydraulic Fracturing Technology Conference, The Woodlands, Texas, Feb. 9–11, 2016.
- Evans, S., E. Holley, K. Dawson, et al, “Eagle Ford case history: Evaluation of diversion techniques to increase stimulation effectiveness,” URTeC paper 2459883, presented at the Unconventional Resources Technology Conference, San Antonio, Texas, Aug. 1–3, 2016; http://dx.doi.org/10.2118/10.15530--urtec-2016-2459883.
- Motiee, M., M. Johnson, and B. Ward, et al, “High concentration polyacrylamide-based friction reducer used as a direct substitute for guar-based, borate cross-linked fluid in fracturing operations,” SPE paper 179154-MS, presented at the SPE Hydraulic Fracturing Technology Conference, The Woodlands, Texas, Feb. 9–11, 2016.
- Applying ultra-deep LWD resistivity technology successfully in a SAGD operation (May 2019)
- Adoption of wireless intelligent completions advances (May 2019)
- Majors double down as takeaway crunch eases (April 2019)
- What’s new in well logging and formation evaluation (April 2019)
- Qualification of a 20,000-psi subsea BOP: A collaborative approach (February 2019)
- ConocoPhillips’ Greg Leveille sees rapid trajectory of technical advancement continuing (February 2019)

