Enhancing production from unconventional reservoirs with micro-proppant
Low-viscosity fluids have become a common carrier fluid during hydraulic fracturing in unconventional reservoirs, especially for brittle shales. Even when hybrid treatments are pumped, slickwater is generally used for most of the pad-stage volume. Proppant particulates have the tendency to settle quickly, to the bottom part of the fracture, in low-viscosity fluid while pumping, and even more so when pumping is ceased. This allows most of the created fracture to close without any proppant present. Woodworth and Miskimins demonstrate that proppant settles quickly and forms a dune at the bottom of the fracture, when a sand-laden, low-viscosity fluid is injected into a fracture.24 The subsequent clean fluid stages erode the proppant and carry it further out into the fracture, thus allowing longer propped fracture half-lengths to be generated.
Warpinski et al. determined that most proppant particles tend to settle into a proppant bed at the bottom of the primary fracture, or in notches.17,18 It was demonstrated that, once the proppant settles and the fracture closes, an arch forms in the closed fracture at the top of the proppant bed, resulting in a high-conductivity channel along the primary fracture for a very-limited height. Even with very low permeability formations, adequate conductivity is still necessary to achieve optimum production from unconventional gas reservoirs. Studies emphasize the importance of fracture conductivity for a partial monolayer and unpropped fracture, combined with the reintroduction of water fracs, where low proppant concentrations are pumped with slickwater.17,8
Low-viscosity fluids provide an advantage, because their residual damage to fracture permeability is much less than when conventional polymeric gelling agents are used as viscosifiers. To take advantage of low-viscosity fluids, low-density proppants have been used with slickwater fluids to yield near-neutrally buoyant proppant slurry, thus minimizing proppant settling within the created fracture.
In relation to access to microfractures generated in the far field, current applications of 100-mesh (i.e., 70/170-mesh) sand might be too large to allow successful placement into these microfractures. Fine particulates, smaller than 100-mesh sand, can provide more opportunity to successfully enter the microfractures, without bridging or screening out at the entrances. Frac sand of 100 mesh or larger is still the ideal propping agent to be placed in primary fractures and their adjacent branches.
This article examines the permeability enhancement of microfractures provided by the micro-proppant (MP) to maintain the surface area and conductive flow paths of hydrocarbons from the far-field regions.
ASMA is an aqueous-based solution, of a surface modification agent, that acts as a tackifying agent when coated onto a substrate surface. This agent is a resinous material that provides adhesion between formation surfaces and proppant grains, and it doesn’t harden or cure under reservoir conditions. When this material, used as a liquid additive, is applied to the fracture faces, during a fracturing treatment, it forms a thin, hydrophobic film on the treated surfaces and renders them tacky. From previous studies, the tackiness of these agents was determined to have several significant benefits.10,19,16
Rendering fracture faces tacky allows the proppant particles to adhere to the coated surfaces. The experiments performed in this study demonstrate how treating ASMA onto the fracture surfaces of split cores greatly enhances both the formation of a partial monolayer of proppant and vertical distribution of the particles.
Clay-control agent. In recent years, an ultra-low-molecular-weight cationic organic polymer has been used as a clay stabilizer during the fracture stimulation of extremely low-permeability formations. Laboratory studies demonstrate that this organic clay stabilizer (OCS) is not only a highly efficient temporary clay stabilizer, but it also provides permanent-type clay treatment, rendering water-sensitive clays insensitive to changes in water composition.23
This OCS was used in conjunction with the ASMA solution to treat split shale faces in this study. Previous studies have shown that by applying a thin hydrophobic film, the treated surface is provided with the best protection against geochemical reactions that lead to loss of fracture conductivity.20,21,22,12
EXPERIMENTS
A small sample from the same split core that was subjected to core-flow testing was obtained for X-Ray diffraction (XRD) analysis. The mineral composition of the shale core sample was: Quartz (50%), Na-feldspar (5%), Calcite (34%), Pyrite (1%), Chlorite clay (2%) and Muscovite/illite (8%).
SPLIT-CORE TESTING
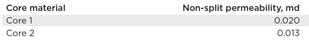
Effective permeability of non-split shale cores. The non-split shale cores were subjected to core-flow testing with nitrogen gas, to determine their non-split permeabilities. The core was installed in a Hassler sleeve. The confining pressure was gradually increased to 1,200 psi, and backpressure was set to 200 psi. Permeability measurements were determined with three different flowrates, and their corresponding differential pressures by starting from the high flowrate. Table 1 shows the permeabilities of the non-split cores for shale materials.
SPLIT SHALE CORES
Cores with a 1-in. diameter and 2-in. length were obtained from outcroppings of shale formations. The dimensions and mass of the cores were recorded. The fracture plane on the core was determined visually. A tool was used to score and form an indentation on the top of the core. A wide-blade chisel and hammer were used to carefully split the core on the plane along its axial length into two halves.
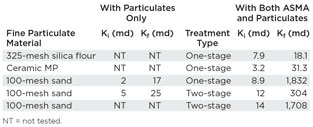
Initial effective permeability (without treatment). The two halves of each core were immersed in a brine fluid containing an OCS; they were then carefully matched, put back together, and tested to determine initial effective permeability. Effective permeability measurements were determined, as with the non-split cores, with nitrogen gas at three different flowrates, and their corresponding differential pressures by starting from the high flowrate, Table 2.
Final effective permeability (treated with fine particulates). This test determined the effect that fine particulates had on the permeability of the split shale core. The core was disassembled, and the faces of the two halves were immersed vertically in a slickwater fluid containing 0.5 lbm/gal of 100-mesh sand, at 140°F for 5 min. The solution of particulates was stirred at 700 rev/min, to help ensure the treatment fluid was in motion, and to maintain particulates in suspension. This solution was prepared in an aqueous-based fluid containing 2% (v/v) OCS and 5 lbm/Mgal of gelling agent. After the immersion periods in the solution of ASMA solution and particulates, the treated halves were then reassembled, with their faces aligned together for core-flow testing with nitrogen gas under the same closure stress and backpressure, as applied in the initial effective permeability flow-testing. Table 2 shows the effective permeability measurements (Kf values) of the split shale core after the treatment of particulates.
FINAL EFFECTIVE PERMEABILITY (WITH ASMA AND FINE PARTCULATES)
One-stage treatment. The ASMA and particulates were combined into a single solution to treat the split faces of the shale core. The shale core was disassembled, and the split faces were immersed vertically in a 0.5% (v/v) ASMA solution containing 0.1 lbm/gal of 325-mesh silica flour, ceramic MP, or 100-mesh sand, at 140°F for 5 min. The solution of ASMA and particulates was stirred at 700 rev/min to help ensure that the treatment fluid was in motion, and to maintain particulates in suspension. This solution was prepared in an aqueous-based fluid containing 2% (v/v) OCS and 5 lbm/Mgal of gelling agent to provide functions of clay stabilization and friction reducer, respectively.
After the immersion periods in the solution of ASMA solution and particulates, the treated halves were then reassembled with their faces aligned for core-flow testing with nitrogen gas under the same closure stress and backpressure, as applied in the initial, effective, permeability flow testing. Table 2 shows the final effective permeability measurements of the split core, after the treatment of ASMA and particulates. After treating with the solution of ASMA and particulates, the effective permeability of the treated split shale was shown to increase multifold, compared to the effective permeability of the untreated, split shale core.
Two-stage treatment. The split faces of the core were first treated with ASMA solution, followed by exposure to the sand slurry. To determine the impact of treatment with an ASMA solution and propping agent, the core was disassembled, and the fracture faces of the two halves were immersed vertically in a 5% (v/v) ASMA solution at 140°F for 10 min. After being removed from the ASMA solution, they were immediately immersed, also vertically, for 20 min. in a 100-mesh sand slurry at 140°F, with a sand concentration of 0.5 lbm/gal. Both the ASMA solution and sand slurry were stirred at 700 rev/min. Both the ASMA solution and the sand slurry were prepared in an aqueous-based fluid containing an OCS and a gelling agent to provide functions of clay stabilization and friction reducer, respectively.
After the immersion periods in the ASMA solution and sand slurry, the treated halves were then reassembled with their surfaces aligned for core-flow testing under the same closure stress and backpressure, as applied for the initial effective permeability flow testing. Table 2 shows the effective permeability measurements of the fractured cores before and after treatments of ASMA solution and proppant slurry, or with and without ASMA treatment.
ESEM EVALUATION
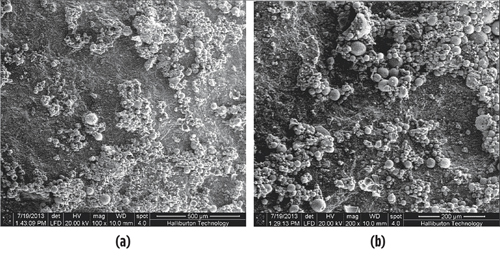
Environmental scanning electron microscopy (ESEM) was used to capture images of the split shale core surfaces, and the proppant grains adhering to the surfaces after the cores were subjected to core-flow testing under closure stress. Clusters or aggregates of particulates were observed to adhere to the split faces, forming a partial monolayer and surrounded by the proppant-free channels. Figure 1 shows the split shale core after immersion in a solution containing ASMA and ceramic MP (one-stage treatment).
MODELING STUDIES
A combination of continuously varying fluid properties, dense laminations, variable mechanical properties, variable reservoir characteristics and unevenly spaced natural fractures, make shale reservoirs extremely complex in terms of hydraulic fracture design and reservoir simulation. Because of this variability, rather than making general statements about simulated well response, a specific case has
been considered.
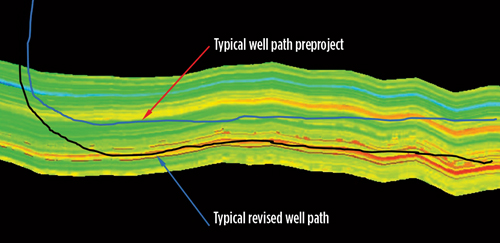
Dahl et al. provides a basis for the reservoir understanding for a liquids-rich region in the Barnett shale, northwest of the core gas region of the field.2 Initial exploration in this region provided some encouraging results, but also significant variation in well performance. Through a detailed process of accelerating reservoir understanding in this region, it became apparent that, even though the lower Barnett layer is 400 ft thick, the drilling target was reduced significantly to the range of approximately 50 ft, because of the presence of clay-rich, high Poisson’s Ratio laminations that made it difficult to sustain fracture conductivity within the layer.
In several cases, large areas of the natural fractures were not in direct communication with the wellbore, because of the presence of these layers located between the wellbore and the highest-quality pay section. Improving wellbore placement was the first step toward providing more consistent, predictable well performance. Figure 2 shows an example of a typical early well drilled during the exploration phase (upper well path shown) of this project, compared to a more refined well trajectory (lower well path shown), avoiding the clay-rich geohazard layer and targeting the higher-quality pay, as was drilled later during the development.
When performing post-fracture treatment simulations, the initial results were modeled using more conventional planar fracture models, and a relatively simple two-perforation-cluster-per-stage configuration. When net pressure matches were performed, it was observed that there was a much better match when multiple matches per cluster were incorporated, suggesting that a significant amount of fracture complexity was likely in this area. This was verified using microseismic interpretation and open-hole image logs.
The use of a complex fracture modeling tool then suggested that, even though complex fracture systems could be created, the secondary fracture widths might not be sufficient to enable effective proppant placement within the fracture network.
To understand the potential impact of more effectively stimulating complex fracture systems, a sensitivity analysis was conducted for a well on which subsurface modeling and post-frac analysis data were available.
A post-frac analysis of hydraulic fracturing, using appropriate pumping schedules, pressures and rates, was used to obtain properties of the hydraulic fractures that became an integral part of the reservoir simulation model. The post-fracturing analysis predicted a total of 37 fractures for the 13 stages of fracturing used for this well. A reservoir simulation model was built around the wellbore, using data extracted, as much as possible, from the subsurface earth model built for the reservoir, and incorporating the fracture attributes from the post-frac analysis. Because fluid composition data and test reports were available for this, as well as several other wells within the same reservoir, PVT tables were created from a common equation of state model (Peng-Robinson based) that captured the effects of fluid property variation within this mostly gas-condensate rich reservoir. Fully compositional numerical simulation runs were made with a commercial simulator for 15 years, for all of the sensitivity cases selected. These cases included sensitivities to matrix permeability, number of fractures created, wellhead pressure, condensate-to-gas ratio (CGR), and the presence of natural fractures to simulate fracture complexity.
The sensitivity study revealed that the matrix permeability has the largest influence on oil rates, followed by fluid composition CGR within the range chosen, then the spacing of natural fractures depicting fracture complexity, the number of hydraulic fractures and wellhead pressure. Some of these findings are similar to those reported by Kumar et al. in another liquids-rich shale play.6
The more effective stimulation of natural fractures showed to have a great capability to enhance the liquids production rate in this complex reservoir. This resulted in several treatment changes that yielded very good results, as summarized by Dahl et al.2 With the advent of MP, however, an opportunity was identified to further improve the conductivity achieved, even in very small, leakoff-induced fractures. One of the key goals here is to ensure that proppant is placed where the treatment fluid travels within the complex fracture system.
Based on the results of this study, a pilot project to test the use of the MP was created and executed to further evaluate the product, as well as the predictive tools used to evaluate
the technology.
Design and execution. This field trial was conducted within the Grassland area of the Barnett shale, in northeastern Wise County, Texas. It consisted of 11 horizontal, wet gas wells within close proximity (the farthest distance between wells was about 1.5 mi.) All wells were designed with similar treatment parameters. The proppants pumped were 100-mesh and 40/70-mesh sand, with a 2.5-lbm/gal maximum concentration. All treatments contained two types of pad stages—initial pad stages (first pad stages) before the proppant stages and spacers (second pad stages) between the 100-mesh and 40/70-mesh stages.
Prior to the 11-well field trial results reported here, there had been many improvements made to the drilling program, the completion plans, and the stimulation treatment designs for the field. One of the proven improvements was that the 40/70 mesh sand was coated with ASMA to improve near-wellbore conductivity. In this 11-well field study, the use of ASMA and/or inclusion of the micro-proppant in the pad stages represents a new and different application for the ASMA.
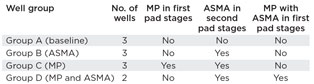
MP was delivered to the wellsite in the form of a concentrated slurry. This material was then metered into the pad fluid to be diluted and obtain the designed treatment concentration. In this study, a MP concentration of 0.1 lbm/gal and ASMA was pumped during the pad stages of the fracturing treatments. The wells are subdivided into groups, varying the use of MP and ASMA, Table 3.
WELL PRODUCTION
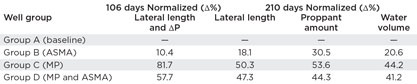
Cumulative production was sampled at 106 days and 210 days over the production life of each well. Gas and condensate production data were normalized, and comparisons were made to determine how MP and ASMA correlated with production.
Normalization of production. Stimulated reservoir volume (SRV) correlating to production in low-permeability, unconventional reservoirs is widely understood. Therefore, normalizations were made to account for variables that would contribute to a change in SRV that is not otherwise attributable to MP or an ASMA. As stated previously, stimulation-treatment designs were similar for the wells. However, there were slight variations in what was actually pumped, and the wells each had different lateral lengths. To account for these variations, 210 days of gas and condensate production for each well were normalized by lateral length, proppant amount and water volume.

Pressure drawdown also influences production. Thus, 106 days of gas and condensate production for each well were normalized by a lateral length and a differential pressure. To minimize variations in the surface flowing pressure, and to minimize any bias in pressure selection, a 10-day moving average curve was calculated for 106 days of surface flowing pressure for each well. A maximum pressure (Pi) and a minimum pressure (Pf) were taken from each and a quasi-drawdown pressure was calculated by subtracting Pf from Pi.
RESULTS
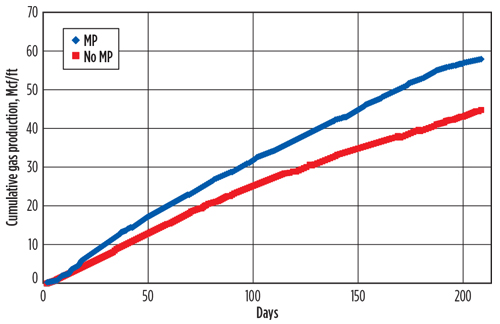
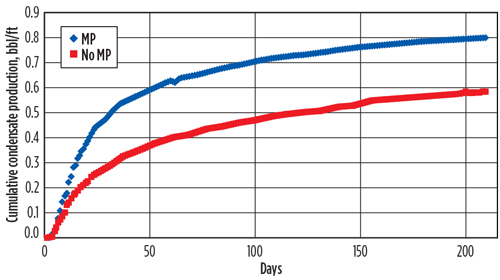
On average, the wells where MP was pumped during the pad stages performed better, in terms of gas and condensate production, than wells that did not include any MP, Figs. 3 and 4.
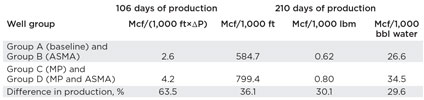
Depending on how production was normalized, well groups with MP (Groups C and D) showed an approximate 20–30% improvement in terms of gas production, and a 30–36% improvement in condensate production over a 210-day period. Upon examination of 106 days of production, normalized to both lateral length and differential pressure, a 30.8% improvement was observed, on average, in gas production and a 63.5% improvement was observed, on average, for condensate output in the MP groups, Tables 4 and 5.
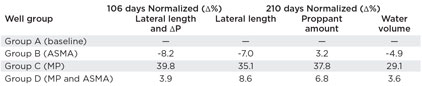
When comparing results individually of just Group C to Group A (baseline), Group C had increased gas production 30–40%, and condensate production by 44–53% over Group A during the 210-day period, depending on the normalization. For the 106-day production normalization, Group C had increased gas production by 39.8% and condensate production by 81.7%, compared to Group A. Group D had increased condensate production by 40–50%, compared to Group A, during the 210-day period, and 57.7% compared to Group A during the 106-day period. However, Group D did not provide improvement in gas production for 106-days or 210 days, Tables 6 and 7.
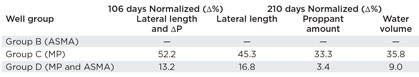
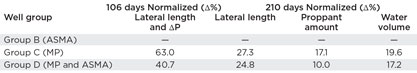
Group C and Group D also outperformed Group B. For the 106-day and 210-day normalized production periods, better condensate output was observed, overall, in both Groups C and D than in Group B. For gas production, Group C clearly outperformed Group B, whereas Group D showed a slight improvement overall, Tables 8 and 9.
DISCUSSION
Laboratory work indicated that the generation of microfractures in tight reservoir formations can significantly increase the effective permeability of a very low matrix permeability core, even without placement of propping particulates in the fractures. The experimental results obtained from this study demonstrate the potential benefits, in terms of a significant increase to effective permeability, that could be gained with new treatment methods and the placement of fine particulates or MP materials into the microfractures, compared to unpropped fractures.
For field trials, there was some question regarding whether the ASMA would benefit the treatment, by providing the sticky surfaces to enhance the formation of a partial monolayer, if the placement of the MP deeper into the fracture system, possibly into small leak-off induced fractures, would be more beneficial. For field operations, it was determined that both procedures should be tested, to see which performed best in real well applications.
During the field trials, the most dominant factor on well performance was the presence of the MP. In all cases within this 11-well test, where MP was used, the wells produced significantly more liquid hydrocarbons over the 210 days of production used for this study. The presence of only the ASMA in the pad fluid did not have a significant positive impact on the productivity, suggesting that in this reservoir, the key objective should be to have the MP transported deep into the reservoir and into the small secondary fractures. Despite the inconclusive benefits of ASMA application in the pad fluid stages performed for this field trial, numerous previous treatments of ASMA coating on proppant during the proppant stages have provided significant conductivity enhancement for the near-wellbore propped fractures in this field, and in other field applications.
Both numerical simulations and field tests in this study provide the evidence supporting the existence of complex fracture networks generated in shale formations of the tested wells. The observed production improvement in wells treated with MP, compared to those without applying the material, strongly indicates the importance of MP for ensuring incomplete closure of very small microfracture systems, providing conductive flowpaths for both gas and condensate. It should be noted that the amounts of MP pumped in all pad stages are negligible, compared to the total amounts of proppant pumped in the proppant-slurry stages. Despite this small MP quantity, the placement of MP in the microfractures has a favorable impact on the overall well production.
The numerical reservoir simulation work performed before this project strongly supported the need to more effectively stimulate natural fractures and connect them to the hydraulically induced fractures. Based upon this, several treatment changes had already been implemented in this region to take advantage of this, including the use of very large quantities of 100-mesh sand. The results of these changes resulted in very significant improvements, in terms of well performance within this region.2,3 The introduction of the MP in this project resulted in an additional increase above the new baseline that was established with the previous stimulation treatment design changes. ![]()
ACKNOWLEDGEMENT
This article is an adaptation of SPE paper 174060-MS. The authors thank Devon Energy and Halliburton for permission to publish this work. The authors also acknowledge Jessica Heeter and Dr. Ray Loghry for their assistance in the experimental work.
- Applying ultra-deep LWD resistivity technology successfully in a SAGD operation (May 2019)
- Adoption of wireless intelligent completions advances (May 2019)
- Majors double down as takeaway crunch eases (April 2019)
- What’s new in well logging and formation evaluation (April 2019)
- Qualification of a 20,000-psi subsea BOP: A collaborative approach (February 2019)
- ConocoPhillips’ Greg Leveille sees rapid trajectory of technical advancement continuing (February 2019)

