Industry at a glance Oil and Gas Prices and Production and Rig Counts
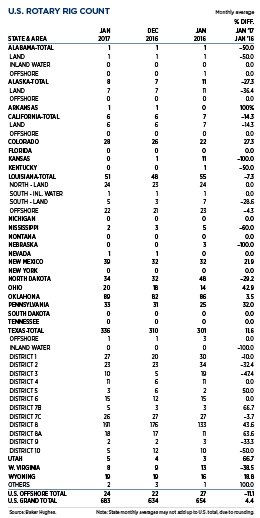
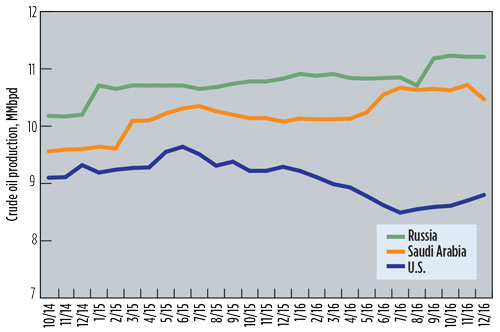
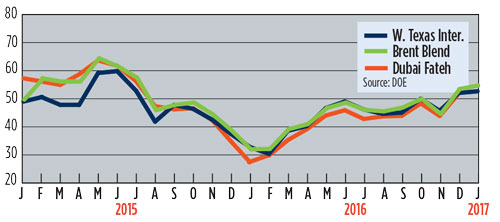
Despite an extreme reduction in worldwide drilling activity during 2015, both WTI and Brent dropped below $30/bbl briefly in mid-January. The market-share battle being waged by Saudi Arabia and Russia shows no sign of abating, with both countries continuing to produce at record-high levels. Also, wells in the large U.S. shale plays are proving more resilient than expected, adding to oversupply. Global oil capabilities expanded by 2.6 MMbpd in 2015, following a gain of 2.4 MMbpd in 2014. The slowing global economy has reduced demand, with growth in 2016 predicted at 1.2 MMbopd. International drilling activity posted a 12-rig gain, as Saudi Arabia became the most active country outside North America. The U.S. rig count average dropped 8% in January, to 656 rigs. ![]()
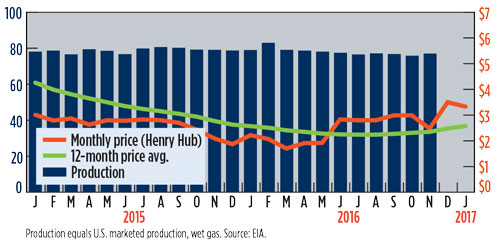
U.S. GAS PRICES ($/MCF) AND PRODUCTION (BCFD) GRAPH
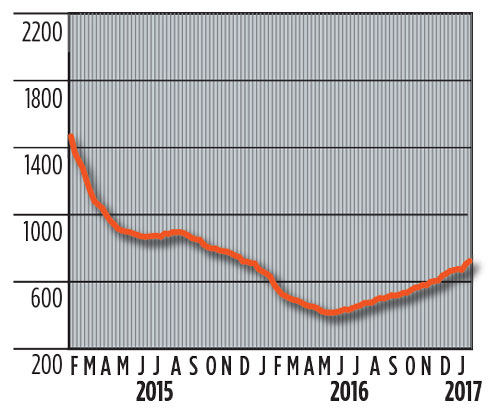
U.S. ROTARY DRILLING RIGS GRAPH
U.S. ROTARY DRILLING RIGS TABLE
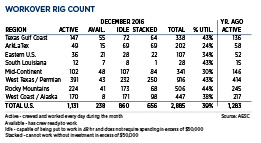
WORKOVER RIG TABLE
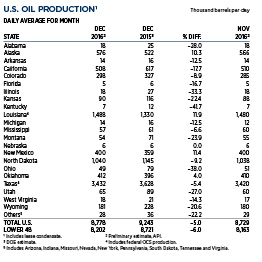
U.S. OIL PRODUCTION TABLE
WORLD CRUDE OIL PRODUCTION, TOP THREE PRODUCERS
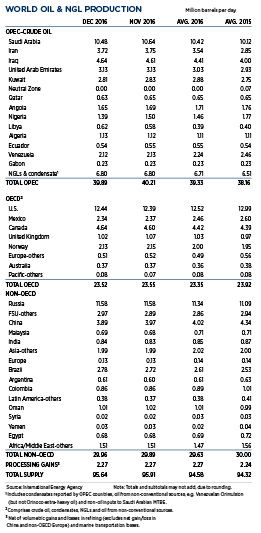
WORLD OIL PRODUCTION TABLE
SELECTED WORLD OIL PRICES GRAPH
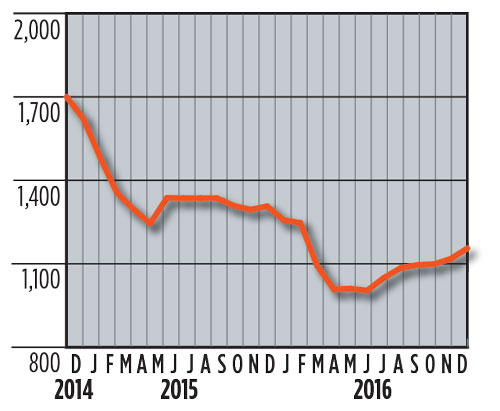
INTERNATIONAL ROTARY RIG GRAPH
INTERNATIONAL ROTARY RIG TABLE
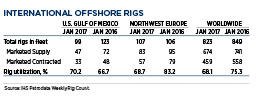
INTERNATIONAL OFFSHORE RIGS TABLE

- Subsea technology- Corrosion monitoring: From failure to success (February 2024)
- Applying ultra-deep LWD resistivity technology successfully in a SAGD operation (May 2019)
- Adoption of wireless intelligent completions advances (May 2019)
- Majors double down as takeaway crunch eases (April 2019)
- What’s new in well logging and formation evaluation (April 2019)
- Qualification of a 20,000-psi subsea BOP: A collaborative approach (February 2019)

