2015 is almost in the rear-view mirror—what will 2016 bring?
We seem to be stuck in a scenario that is oddly similar to a scene in the movie, Groundhog Day. Every day, we wake up to low oil prices and the “lower-for-longer” refrain. Yes, 2015 is almost over. Yet, just like a year ago, we are anxious to be rid of the current year, as we hope to usher in an improved crude oil market— 2016 will be better! We believe that the current 2016 NYMEX price of $45/bbl will prove to be too low (we have an $80/bbl second-half 2016 forecast), as demand growth and supply declines will tighten the market.
You heard it here first—we forecast a tightening market in 2016, as global demand will continue to grow, and non-OPEC supply, led by the US, will decline.
Global demand. We forecast continuing global demand growth in 2016, albeit at a slower pace than the surprising 1.8-MMbopd (1.9%) growth that we experienced in 2015. Our 1.0-MMbopd rate (1.1%) next year assumes slower growth, and we allocate 25% of the growth to China and more than 50% to all of Asia. OECD growth slows to a snail’s pace from 600,000 bopd (1.3%) in 2016. There is upside to our forecast, if lower prices prevail and continue to spur consumption. Downside? If the China fear in the market is real, our forecast could prove too optimistic. But, remember that since 1986, annual global demand has only contracted twice—in 2008 and 2009—after which 2010 demand rebounded greater than 3%.
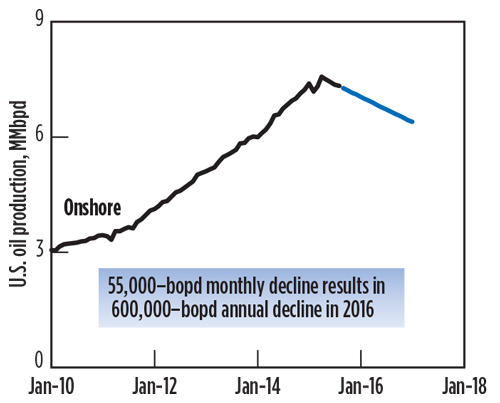
U.S. supply. The U.S. rig count is down 65% from peak levels of late 2014. It has been our view that this reduced activity would ultimately result in U.S. production declines and that the natural gas “analog” did not apply (the natural gas rig count steadily declined for several years, yet gas production did not). Yet, U.S. Lower 48 onshore production has been declining since April, and our 400,000-bopd, year-on-year decline in 2016 will likely prove too optimistic (i.e, could decline 600,000 bopd or more), as drilling activity drifts lower in December 2015 and early 2016, if low $40/bbl prices continue.
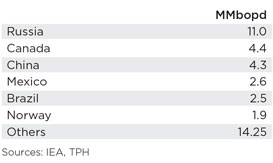
If the U.S. is declining, what about the “rest of non-OPEC”? Each key country (Russia, Canada etc.) has different variables that make forecasting supply very difficult, Table 1. As each key country is important, the most significant component may be the “Others,” as more than 25 countries make up more than 35% of the rest of non-OPEC output. Overall, we believe that the rest of non-OPEC will decline slightly in 2016, but major projects already underway will dampen the impact of low oil prices until 2017/2018. Current project cancellations or deferrals of project sanctions will impact supply in 2017 and beyond, much more than in 2016.
One major surprise from last year has been the 1.5-MMbopd increase in total OPEC supply. The increased oil supply is due mainly to Saudi Arabia (up 700,000 bopd) and Iraq (up 900,000 bopd). The market is concerned with the potential for post-sanctions Iranian oil production to increase. The Iranians suggest that 1.0 MMbopd are possible, but we believe a sustainable production increase of 500,000 bopd is more likely. In the Dec. 4, 2015, OPEC meeting the members, led by Saudi, essentially decided to do nothing, letting their current output of 31.5 MMbopd serve as the defacto quota. This contrasts with the meeting a year ago, when the Saudis pulled the rug out from under the oil markets.
Missing barrels. Welcome to 1998, as the missing barrels are back! In fact, this is why we think the market can tighten faster than the consensus. Simply stated, the observed OECD inventory builds in late 2014 and early 2015 showed a market that was oversupplied (inventory builds larger than normal) but much less oversupplied than published supply-and-demand numbers would suggest. For example, second-quarter 2015 OECD inventories built at a pace of 1.0 MMbopd, yet early indications had supply exceeding demand by more than 3.0 MMbopd! This is the origin of the oft-repeated notion that the market was 3.0 MMbopd oversupplied. More recent supply and demand data suggest that second-quarter 2015 is roughly 2.0 MMbopd oversupplied, as demand has been revised higher and supply lower (we bet that the revisions continue in coming months).
Bottom line? If the market is closer to being in balance than the consensus believes, and U.S. production leads non-OPEC supply lower, and global demand exhibits reasonable growth, then the market will tighten in 2016, and our $80/bbl, second-half 2016 price will prove spot-on. ![]()
- Applying ultra-deep LWD resistivity technology successfully in a SAGD operation (May 2019)
- Adoption of wireless intelligent completions advances (May 2019)
- Majors double down as takeaway crunch eases (April 2019)
- What’s new in well logging and formation evaluation (April 2019)
- Qualification of a 20,000-psi subsea BOP: A collaborative approach (February 2019)
- ConocoPhillips’ Greg Leveille sees rapid trajectory of technical advancement continuing (February 2019)

