MARTIN T. K. SOH, Reservoir Modeling and Monitoring Consultant, and AZHAR AL KINDI, Petrogas E&P LLC
It is well known that tight and shale hydrocarbon reservoirs became economic to produce, because of hydrofrac and horizontal well technologies. Hydrofracs are essentially high conductivity pathways linking the reservoir matrix to the wellbore. Both hydrofracs and horizontal wells helped to dramatically increase reservoir contact from the wellbore, increasing ultimate well recovery and reducing lifting plus development costs. Intrinsic reservoir productivity, in context with the production environment (e.g. offshore, onshore, harsh, tropical), determines economics, and whether or not reserves are “unconventional” or, in historical parlance, even “stranded.”
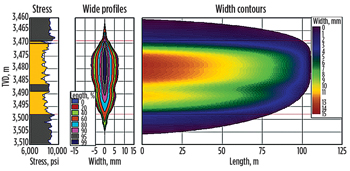 |
| Fig. 1. Transverse hydrofrac profile, showing aperture and half-length from the wellbore. |
|
Hydrofrac conductivity is determined by fracture aperture, half-length and permeability. Using traffic as an analogy, the aperture is the road capacity (e.g. number of lanes), the half-length is the road length, and the permeability is the speed limit. The conductivity is the throughput of the hydrofrac. There are trade-offs between aperture, half-length and permeability that need to be balanced to determine an optimum configuration. Figure 1 shows a typical (transverse) hydrofrac profile. The aperture, half-length and permeability profiles are simplified into average aperture, half-length and permeability for analytical models and computational simplicity. Benefits far outweigh disadvantages, due to much larger, inherent reservoir uncertainty.
With the benefits of hydrofrac technology qualified, our attention is now focused on how to quantify its impact. Initial well rates, declines and ultimate recovery (UR) are typical benchmarks used to determine whether a proposed fracture treatment is economic to implement. Similarly, quantifying hydrofrac well performance to the hydrofrac properties is important to assessment of effectiveness and lessons learned. The “a priori” type of well decline curve is commonly used to predict future undeveloped well rates, declines and UR. This type well decline curve is determined from a compilation of producing well performance data. This approach’s biggest limitation is that it does not directly account for individual well circumstances (location, improvements in hydrofrac design/implementation, number of stages etc). Also, as many of these wells have long projected lifespans, the decline factor used significantly impacts UR. Figure 2 illustrates the issues raised by using this type of well approach.
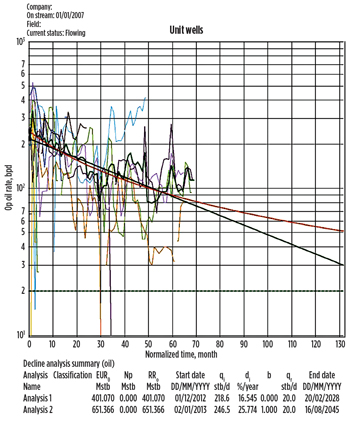 |
| Fig. 2. Undeveloped well decline performance prediction for an oil reservoir. Two P50 best-fit well functions are fitted: Analysis 1 with the decline factor (b) set to 0 (exponential decline); and Analysis 2, where the decline factor is allowed to vary between 0 and 1. Analysis 2 UR is 50% greater than Analysis 1. |
|
Analytical approaches may also be used, but, like decline curve analysis, all static and process variables cannot be captured. Reservoir simulation has been suggested as a better alternative used in a methodical manner to capture and predict the physical processes. How to capture these processes is the focus of present work. Understanding the assumptions and using them appropriately is key to achieving the desired purpose.
UNDERSTANDING FLOW DYNAMICS
The term, flow dynamics, describes interactions between the wellbore, fracture and reservoir. All subsurface reservoir systems have a stress regime that can be described in three orthogonal, principal dimensions (for example: one vertical and two horizontal). The vertical is typically the overburden. A hydraulic fracture will propagate normal to the direction of the minimum stress. As long as the overburden stress is not the minimum principal stress, a transverse fracture will be created. Otherwise, a “pancake” fracture is created.
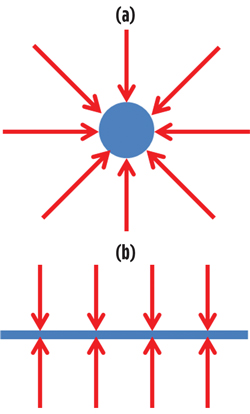 |
| Fig. 3. (a) Radial and (b) Linear flow regimes into a wellbore. |
|
The hydrofrac’s orientation affects its interaction with the reservoir. To understand the interaction, consider the most basic case, a vertical well producing from the reservoir without stimulation. The steady state flow regime can be described as radial flow (flux entering the wellbore in a concentric manner). In fact, the steady state flow regime for all well configurations is radial. Now, consider a horizontal well; the intermediate flow regime can be described as linear flow (flux entering the wellbore normal to its length). Figure 3 illustrates the radial and linear flow regimes. The hydrofrac orientation affects the intermediate flow regime. Linear flow will be seen for a transverse hydrofrac, while radial flow will be seen for a pancake hydrofrac.
With the importance of correctly describing the hydrofrac in a simulation established, the next concern is how to simulate the hydrofrac. There are many modeling methods available: single-porosity, dual-porosity, dual-permeability, multiple-interacting-continua (MINC, available in CMG simulators). The choice depends on the flow dynamics that are to be characterized. If the reservoir is naturally fractured, then the dual-porosity, dual-permeability and MINC methods need to be considered. Otherwise, single-porosity modelling is acceptable.
The difference between the dual-porosity, dual-permeability and MINC methods is how the matrix-matrix interactions are defined. In a dual-porosity model, flow can only occur between fractures and from the matrix into the fracture. This is acceptable, where the hydrocarbon is immobile in the matrix (e.g. sorption processes common in CBM). The dual-permeability model allows matrix-matrix flow, which is important in modeling gravity drainage (e.g. formation of a secondary gas cap in matrix, capillarity differences). The MINC approach extends the dual-porosity method, except gradients in diffusion time gradients (i.e. time taken for hydrocarbons to diffuse from the matrix to the fracture-matrix interface) can be modeled.
Choosing an appropriate simulation basis for the hydrofrac ensures that the representative flow dynamics are modeled in the wellbore and within the reservoir. Their impact on well performance and UR is significant.
FRACTURE IMPLEMENTATION IN MODELS: CASE STUDY
Then, attention was focused on how to implement transverse hydrofracs in a simulation model. In this case study, we considered single-porosity modeling. The principles outlined are applicable in naturally fractured reservoir systems, too. In this oil field, a 1-km horizontal well was to be drilled, to drain the reservoir. Average grid dimensions were 290 x 290 ft. Four transverse hydrofracs were proposed to enhance well productivity and UR over the base case, unstimulated completion. A fracturing program was designed, using available formation data. The optimum, average hydrofrac properties are:
- Average fracture permeability = 148,200 mD
- Average fracture half-length = 344 ft
- Average fracture width = 0.015 ft.
- Various modeling strategies were considered:
- No local grid refinement to define fracture voxels
- Linear, local grid refinement to define fracture voxels
- Linear, local grid refinement to define fracture
- Logarithmic, local grid refinement to define fracture.
No local grid refinement (LGR) is applied to reservoir simulation models to manage numerical dispersion effects, due to coarse grid dimensions. A common LGR application is where well perforations are located in adjacent voxels. Computation time increases with more voxels, and sometimes add-ons need to be purchased, to enable the feature. Its application needs to be justified, and its impact understood. In this example, where no LGR is applied, the fracture permeability will need to be adjusted to reflect the voxel size: 148,200 mD; 0:015 ft = 290 ft = 7:5 mD. Figure 4 illustrates the model implementation and simulation results. Application of four fractures resulted in 20% UR improvement over the unstimulated base case.
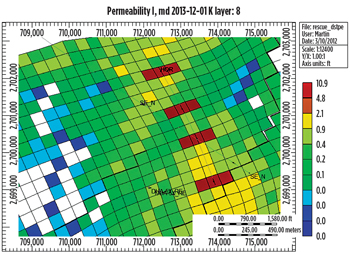 |
| Fig. 4. (a) Four no-LGR hydrofrac implementation; and (b) simulation result, with unstimulated base case shown in dotted line for comparison. |
|
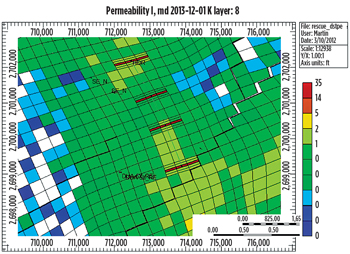
Local grid refinement. We considered three linear-spaced LGR cases with varying degrees of refinement: 3×, 5× and 7×. The hydrofrac permeability also needed to be scaled down, to reflect the refinement: 23, 35 and 52 mD, respectively. Figure 5 illustrates the LGR model implementation for the 5× case. The case results are illustrated in Fig. 6. There is a 65–80% improvement in well UR for the LGR cases. This is significantly different from the no-LGR result.
|
|
| Fig. 5. Linear LGR implementation in simulation model grid. The example shown here is for the 5× case. |
|
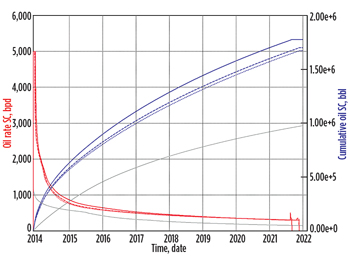 |
| Fig. 6. Simulation results of linear LGR cases: 3× (line), 5× (dashed), 7× (dotted); with unstimulated base case shown in light grey for comparison. |
|
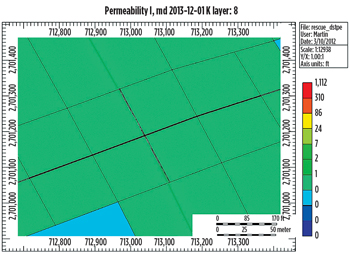
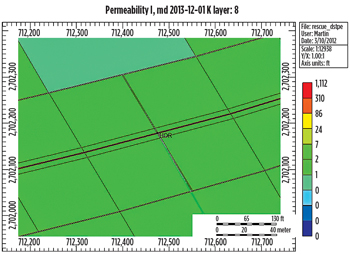
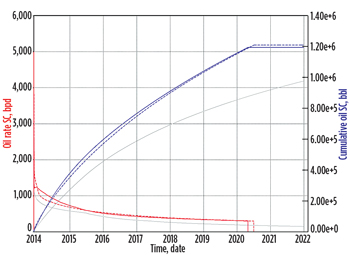
Logarithmic-spaced LGR. The idea of logarithmic-spaced LGR gridding is to create a hydraulic fracture cell width similar to that of the hydraulic fracture. As the minimum grid block dimension must exceed the well radius for simulation, a 2-ft dimension is used. An additional advantage of logarithmic-spaced fractures is that the pressure gradient around the fractures also follows a logarithmic profile. Figure 7 illustrates the 3× and 5× logarithmic spaced fracture implementation in the simulation grid. The fracture permeability is 148,200 mD × 0:015 ft / 2 ft = 1,112 mD. The logarithmic spaced hydrofrac simulation results are illustrated in Fig. 8, and indicate a 20% improvement in well UR over the unstimulated base case.
|
|
| Fig. 7. Logarithmic-spaced LGR implementation in simulation grid: (a) 3× and (b) 5×. |
|
|
|
| Fig. 8. Logarithmic-spaced hydrofrac simulation results: 3× (line), 5× (dashed); with unstimulated base case shown in light grey for comparison. |
|
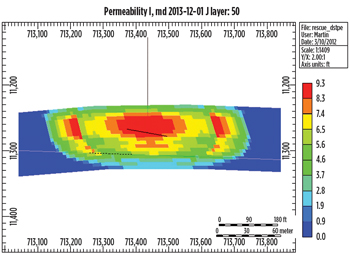 |
| Fig. 9. Mapped fracture LGR implementation in simulation grid. No LGR has been applied along the wellbore trajectory in this case. |
|
 |
| Fig. 10. Mapped fracture LGR simulation result, with the unstimulated base case shown in light grey for comparison. |
|
Mapped fracture LGR. This similar to the no-LGR case, in that there is no LGR applied on the wellbore trajectory. The difference is that the fracture profile away from the wellbore is mapped to replicate the fracture profile, Fig. 9. Figure 10 shows the well production forecast and UR, indicating a 70% increase in UR over the unstimulated base case. For comparison, the no-LGR UR is only a 20% increase over the base case, although permeability is similar (5–10 mD).
UNDERSTAND FRACTURES TO UNDERSTAND SIMULATION RESULTS
| Table 1. Summary of hydrofrac simulation results in Section 3. |
|

|
Table 1 summarizes the hydrofrac simulation results. There is a large variation in UR between the cases. Which implementation (and result) is most representative? Can we explain the results? Comparing the well production profiles of all the cases in Figure 11 yields the following:
- The no-LGR hydrofrac profile is similar to the unstimulated base case, suggesting a wellbore stimulation effect
- The late time declines of the LGR hydrofrac implementations are similar, indicating similar steady state flow dynamics between the fracture and reservoir
- The difference between LGR hydrofrac implementations is the early time behavior, in particular the initial rate.
- These observations indicate that, for the grid implementation used in this case study, some form of LGR is required to properly model the transverse hydrofrac flow dynamics.
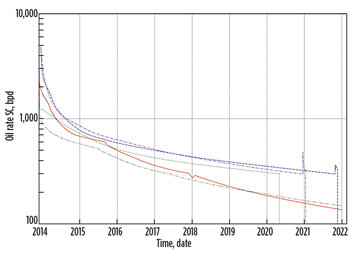 |
| Fig. 11. Well production profiles for the various hydrofrac implementations: red line (no LGR), blue dashed (5× linear LGR), green dotted (logarithmic LGR 3×), and magenta dash/dot (mapped LGR). The unstimulated base case is shown in light grey (dash/dot/dot) for comparison. |
|
Hydrofracs are high-conductivity conduits with low inherent volume. The higher initial rates of some LGR implementations indicates that these fractures have significant pore volume, resulting in higher initial rates. Fracture permeability for the linear LGR implementations also has a secondary effect on initial well productivity, and permeability contrast between the fracture and reservoir, but that is not so pronounced in the examples presented here. Constructing a reservoir model that closely matches the physical characteristics of the hydrofrac will to yield a more representative forecast: logarithmic spaced fractures. However, capturing geological uncertainty and well performance impairment is also important. This case study suggests that a four-hydrofrac implementation will only result in a 20% increase in well UR over the unstimulated base case, although depending on implementation, up to an 80% increase is possible. Assumptions have big impacts.
SUMMARY
Whatever method is used, it is critical to model the hydrofrac’s physical characteristics to predict well performance. In the case study, the representative case predicts a smaller proportional increase in well UR over the unstimulated base case. It is clear that the underlying assumptions used do have a big impact on hydrofrac reservoir simulation results, and the bottom line. 
|
The author
MARTIN SOH, PHD, is as a reservoir modeling and monitoring consultant, working with operators worldwide to overcome development and production challenges. Dr. Soh is a member of SPE, most recently serving on the SPE Forum organizing committee on “70% Recovery: applications from nano to macro,” in May 2013. He is also a Fulbright alumnus, having received the Clough Ltd Fulbright Fellowship in Engineering. He received his PhD with Distinction from the University of Western Australia.
AZHAR AL KINDI is the Chief Operating Officer for Petrogas E&P in Oman. Before returning to Oman, he served Shell in Australia as the Regional Reservoir Engineering Manager; and prior to that, mature Alaskan opportunities and GOM Brown field developments. Before Shell, Azhar worked in various assets and fields for Petroleum Development Oman, which he joined immediately upon graduating from Durham University in 1995.
|
|

