SAM GORGEN, JOHN STAUB and TANCRED LIDDERDALE, U.S. Energy Information Administration
U.S. crude oil output is forecast to rise 815,000 bopd this year to 7.25 million bopd, according to the February 2013 Short-Term Energy Outlook (STEO). Production is expected to rise by another 570,000 bopd in 2014 to 7.82 million bopd, the highest average level since 1988. Most of the U.S. production growth over the next two years will come from drilling in tight formations in North Dakota and Texas. This article explains the underpinnings of EIA’s short-term forecast for crude oil production.
Increases in tight oil production are driven by the use of horizontal drilling, in conjunction with multi-stage hydraulic fracturing, which provides both high initial production rates and high revenues at current oil prices. Additional technological and management improvements have increased the profitability of tight oil production, thereby expanding the economically recoverable tight oil resource base and accelerating the drive to produce tight oil. These technology and management improvements include, but are not confined to:
- Multi-well drilling pads
- Extended-reach horizontal laterals, up to 2 mi in length
- Optimization of hydraulic fracturing through micro-seismic imaging and enhanced interpretation
- Simultaneous hydraulic fracturing of multiple wells on a pad
- Drilling bits designed for specific shale and tight formations
- “Walking” drilling rigs.
Further improvements in technology, such as selective fracturing along the horizontal lateral to avoid zero or low production stages, based on local geologic characteristics, might further improve the economics of tight oil production. Even so, diminishing returns to scale and the depletion of the high-productivity “sweet spots” are expected to eventually slow the rate of growth in tight oil production. It is difficult to predict when that inflection point will be reached, because it can be pushed farther into the future by increases in the number of drilling rigs and further technological changes.
FORECAST OVERVIEW
The growth in U.S. crude oil production over the past several years has come largely from onshore basins in which E&P companies are most active, Fig. 1. Currently, the most important basins for production growth are the Williston in North Dakota and Montana, which includes the Bakken formation, the Western Gulf in south Texas, which includes the Eagle Ford formation, and the Permian in West Texas and southeastern New Mexico, which includes the Spraberry and Wolfcamp formations.
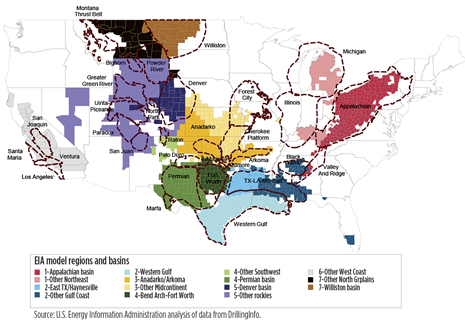 |
| Fig. 1. Key onshore crude oil production basins. |
At present, drilling activity is focused mostly on “tight,” or very-low-permeability geologic formations, including shales, chalks and mudstones. These formations are particularly attractive, because the drilling and fracturing of long horizontal well laterals yields high initial production volumes.
EIA estimates that total U.S. oil production will increase from 6.89 million bopd in November 2012 to 8.15 million bopd in December 2014, Fig. 2. In the Lower 48 states, excluding the Gulf of Mexico federal offshore region, production is forecast to rise from 4.97 to 6.10 million bopd over the same period, representing most of the increase in U.S. oil output. Oil production from offshore fields is expected to resume an upward trajectory, as operators intensify exploration and development in the deepwater portions of the Federal GOM. Federal GOM production should increase from 1.37 million bopd in November 2012 to 1.55 million bopd in December 2014. At the same time, EIA expects that the contribution from Alaska and other mature onshore areas in the Lower 48 states will continue to wane.
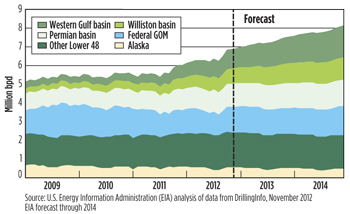 |
| Fig. 2. Regional oil production forecasts. |
It is expected that E&P companies will continue to focus primarily on existing and emerging tight oil formations, where the combination of horizontal drilling and hydraulic fracturing generates high initial production rates. While oil production from other sources will continue to account for most of the country’s output, production volumes from tight formations, such as the Bakken, Eagle Ford and Spraberry, are forecast to steadily increase tight oil’s production share, reaching about one-third of total U.S. oil output by 2014, Fig. 3.
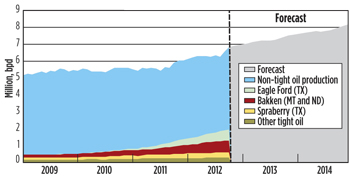 |
| Fig. 3. Selected tight oil production history and U.S. oil production forecast. |
PRODUCTION GROWTH FOLLOWS DRILLING
Tight oil production growth is driven by the number of rigs drilling wells, how quickly those rigs can drill a well, how productive each well is initially, and how quickly production from each well declines. Forecasting this growth in production depends both on historical data and assumptions about potential changes to each of these factors. Drilling activity is a leading indicator of future production growth, because it is the most current data available. Drilling activity is measured by the number of rigs drilling for oil and/or natural gas within a region.
Drilling efficiency, the number of days required to drill a well, quantifies the speed of drilling wells. Drilling wells faster effectively increases the number of rigs. Drilling efficiency is estimated from the number of wells that start production over a certain time period compared with the number of rigs in operation, after accounting for an assumed lag to complete the wells.
EIA uses publicly available weekly and monthly rig counts from Baker Hughes and Smith Bits. This information, in conjunction with data regarding the average number of days a rig takes to drill a single well, provides an estimate of the number of wells that will be drilled and completed over a specific time period for a particular region.
HORIZONTAL AND MULTIPLE-WELL PAD DRILLING
In some basins, such as the Permian and Denver, producers often drill through, hydraulically fracture, and produce from multiple stacked tight formations, spanning hundreds to thousands of vertical feet. In contrast, producers in the Western Gulf and Williston basins drill vertically into a single tight oil formation targeted for production, then drill horizontally through the formation. Horizontal wells expose thousands of feet of oil-bearing formation surface to achieve the same effect as fracturing thousands of feet of vertical depth through multiple formations using a vertical well. However, horizontal wells are more expensive.
In those tight oil formations where horizontal drilling is extensive, producers have gradually lengthened the horizontal lateral. In the Bakken, for example, horizontal laterals are now typically 10,000 ft in length with 30 fracturing stages. Long-lateral wells not only help reduce well costs per barrel produced, and increase production, they also reduce producer risk by ensuring that a large cross-section of rock is exposed to production. This way, the highly productive stages in a lateral offset its low productivity stages. However, because horizontal laterals are more expensive to drill, there are diminishing returns.
Multiple-well pad drilling, in which multiple wells are drilled from a single surface location, is assisted by the availability of horizontal drilling technology. Multiple-well pad drilling decreases the site preparation and remediation costs associated with single-well drilling pads, while also reducing the environmental impacts with a smaller drilling footprint. Multiple-well pads also allow producers to operate at greater economies-of-scale, because they can handle larger production volumes at a single site, thereby reducing operating and maintenance costs. Another recent time- and cost-saving innovation being employed by tight oil producers is the walking drilling rig, which can move between wells on the drilling pad without having to be disassembled and reassembled.
LEASE STRATEGIES AND DRILLING EFFICIENCY
For some tight formations, such as the Bakken and Eagle Ford, where the most desirable acreage has already been leased, producers are now achieving further economies-of-scale by buying, selling and trading leases to increase the size of their contiguous lease acreage. This allows their drilling and production crews to operate within fewer and larger leaseholds, rather than across a dispersed set of smaller-sized leases. The North Dakota Industrial Commission’s unitization of leases in a 1 × 2-mi grid pattern should create long-term infrastructure efficiencies.
FUTURE EFFICIENCY GAINS WILL BE GRADUAL
The well drilling and completion efficiency gains that have been achieved over the last few years not only improve the well profitability of the tight formation sweet spots, but also turn portions of the formation that were not previously profitable to produce into profitable acreage. So the net effect of all these efficiency gains is to increase the size of the economically recoverable tight oil resource base.
Although oil producers have greatly improved the economic efficiency of drilling and completing tight oil wells, the rate of change in efficiency improvements is expected to slow down in the future and become more representative of the overall rate of technological improvement experienced by the oil and gas industry as a whole. For example, Bakken well laterals are typically 10,000 ft long with 30 hydraulic fracturing stages. A Schlumberger research report indicates that this is the optimal number of fracturing stages for a Bakken well of that lateral length. The easy improvements in tight oil well drilling and completion efficiency (e.g., longer laterals, pad drilling) have apparently been achieved.
Moreover, as the high-productivity portions of the tight oil formations (i.e., sweet spots) are depleted, drilling activity will have to focus on the less-productive portions of the tight formations, requiring more well completions just to maintain oil production. A slower future rate of technological improvements, combined with drilling in less-productive areas, will require more drilling rigs, to increase or maintain tight oil production.
ONSHORE FORECAST ASSUMPTIONS
EIA’s short-term crude oil production model forecasts liquids production in the major onshore basins. In each basin, the number of new oil wells drilled each month is estimated from a forecast of oil-directed rig count and rig efficiency. Rig efficiency, or the number of wells drilled per rig each year, is derived from the recent number of new oil wells starting production in a basin compared to the number of drilling rigs operating in that basin. Forecast rig efficiency also takes into consideration the degree of technological and management improvements that are expected to occur over time.
New well production profiles are also estimated for each basin, Fig. 4. Initial well production (IP) rates and monthly decline rates of the new wells are estimated, using recent historical data for the wells producing in each of the three key basins. The IP rate is an estimate of the average daily flowrate over the first 30 days. Because some wells come online at the beginning of the first month while others come online in the middle or at the end of that month, the first month of production for the average well is generally half the estimated IP. So the second month of production is greater than the first month.
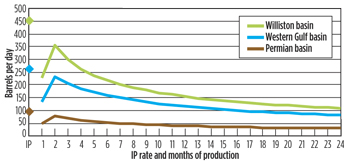 |
| Fig. 4. Production profile of average wells in three key basins, 2011 to present. |
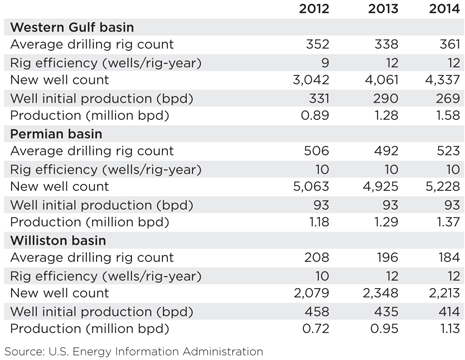
In the Western Gulf basin, the rig count declined during the second half of 2012, but it is forecast to increase moderately during 2013 and 2014, Table 1. While a rig typically takes longer than a month to drill a new well, the increased use of pad drilling, as described below, is expected to increase rig efficiency to about one well per rig per month in 2013 and 2014. Based on the rig count rising to about 360 in 2014, about 8,400 total new wells would be drilled in 2013 and 2014 in the Western Gulf basin.
| Table 1. Forecast assumptions for liquids production in three key basins |
|
|
In 2012, the majority of new wells drilled in the Western Gulf basin were horizontal wells. In 2013 and 2014, the proportion of horizontal wells is expected to increase, as the Eagle Ford formation is further developed. As a result, the production profile of an average well in this basin will closely resemble the profile of an Eagle Ford horizontal well, with high initial production rates followed by a steep decline. The IP rate of a Western Gulf basin well is forecast to be 290 bopd in 2013. The IP rate declines to 269 bopd in 2014, as some of the Eagle Ford sweet spots are completely drilled and producers move into areas with lower well productivity. Overall, these changes result in Western Gulf basin oil production increasing from 890,000 bopd in 2012 to 1.28 million bopd in 2013, and 1.58 million bopd in 2014. By December 2014, oil production is forecast to reach 1.71 million bopd, making this basin the largest domestic oil producer.
The Williston basin, which contains the Bakken formation, is forecast to exhibit slow production growth from 2013 to 2014. Similar to the Western Gulf basin, EIA forecasts rig efficiency to rise to about one well per rig per month through 2014. As the horizontal wells in this region are generally longer than in other regions, and one drilling pad can develop oil from a larger area, rig counts are forecast to decline from an average of 208 rigs in 2012 to about 196 in 2013, and 184 in 2014, with over 4,500 new wells being drilled through 2014.
| Table 2. U.S. New pipeline projects delivering crude oil to Cushing, Okla., 2010–2012 |
|
.png)
|
In the Williston basin, almost all new wells are horizontal, and this trend will continue in 2013 and 2014. Williston basin wells have very high IP rates, averaging 435 bopd in 2013, declining to 414 bopd in 2014 as the basin’s sweet spots are fully drilled. Although Williston IP rates are very high, with fewer wells forecast to be drilled, Williston basin oil production is not forecast to grow as much as in the Western Gulf basin. Williston oil production increases from 720,000 bopd in 2012 to 950,000 bopd in 2013 and 1.13 million bopd in 2014, with December 2014 production averaging just under 1.19 million bopd.
Winter weather is contributing to a delay in completing wells after they are drilled, and, thus, is currently slowing the growth in Williston basin oil production. The spring thaw and weight restrictions on roads may also slow production growth.
Permian basin wells have different production and spacing characteristics than wells in the Western Gulf and Williston basins, because of the large proportion of vertical wells. In 2012, an average 506 rigs worked in the basin, drilling slightly less than one well per rig per month. Permian basin production growth is driven by the large number of new wells drilled during 2013 and 2014, with about 10,150 new wells drilled through 2014.
Vertical wells in the Permian basin have lower IP rates, Fig. 4. New wells forecast for 2013 and 2014 will have an average IP rate of 93 bopd. Although each well produces less oil initially, the large magnitude of new wells will increase production from an average of 1.18 million bopd in 2012 to 1.29 million bopd in 2013, and 1.37 million bopd in 2014. In December 2014, production is forecast to be 1.41 million bopd.
PIPELINE INFRASTRUCTURE
The rapid growth of production from tight oil plays in the U.S. Mid-Continent, as well as the development of oil sands in Canada, has dramatically changed the balance of flows at Cushing, Oklahoma, which was historically the distribution hub of imported and West Texas crude oil for Gulf Coast refineries. Over the last three years, pipeline capacity for delivering crude oil to Cushing increased by about 815,000 bopd (solid lines, Fig. 5). The key development was the construction of the 590,000-bopd TransCanada Keystone pipeline that originates in Hardisty, Alberta, Canada. Phase 1 of the Keystone pipeline, which runs from Hardisty to Steele City, Nebraska, and on to Patoka, Illinois, was completed in June 2010. Phase 2 of the Keystone pipeline, which extended the pipeline from Steele City to Cushing, was completed in February 2011.
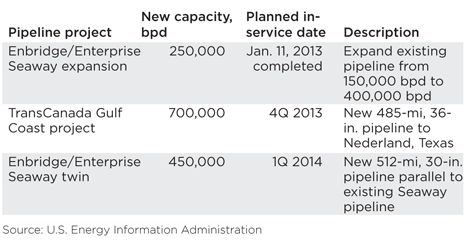
Until mid-2012, there was only one pipeline that could deliver crude oil from the Midwest to the Gulf Coast. The 96,000-bopd ExxonMobil Pegasus pipeline between Patoka, Illinois, and Nederland, Texas, originally shipped crude oil northward. The pipeline was reversed in 2006 in order to ship Canadian heavy oil to the Gulf Coast. The growing supply of crude oil into Cushing quickly exceeded the capacity of Midwest refineries to process it. As a result, the 150,000-bopd Seaway pipeline carrying imported crude oil from the Gulf Coast to Cushing was reversed in May 2012. Because it takes four years or longer to plan, obtain permits, and build new interstate pipelines, major expansion of new pipeline capacity to deliver the fast-growing Mid-Continent crude oil production to the Gulf Coast is just now nearing completion. The Enbridge/Enterprise Seaway Expansion brought 250,000 bopd of new capacity into service on Jan. 11, 2013. A new pipeline with 700,000-bopd capacity is expected to be completed in fourth-quarter 2013, and an additional 450,000 bopd of capacity is expected to be added in 2014, Table 3. In anticipation , 1,225,000 to 1,315,000 bopd of new pipeline capacity to deliver crude oil into the Cushing hub is also planned, Table 4.
| Table 3. New pipeline projects from Cushing, Okla. to the Gulf Coast, 2013–2014 |
|
|
| Table 4. U.S. New pipeline projects delivering crude oil to Cushing, Okla., 2010–2012 |
|

|
Crude oil production in the Permian basin faces the same transportation constraints as Canadian oil and crude produced in the Mid-Continent. Two pipelines currently transport crude oil from the Permian basin to Cushing: the Plains All American basin pipeline, which was expanded from 400,000 to 450,000 bopd in early 2012, and the 175,000-bopd Oxy Centurion pipeline. A third pipeline, the Sunoco Logistics West Texas Gulf pipeline, has the capacity to transport 300,000 bopd from the Permian basin to Longview, Texas, where it connects with the Mid-Valley pipeline to Samaria, Michigan. Because the existing pipelines are nearly fully utilized and deliver crude into the over-supplied Midwest market, six pipeline projects that include pipeline reversals, expansion and new lines would provide 355,000 bopd of new capacity to move crude oil from the Permian basin to the Gulf Coast in 2013, and 478,000 bopd of new capacity in 2014, Table 5.
| Table 5. Planned new pipelines from the Permian basin to the Gulf Coast |
|

|
Over the past three years, almost 815,000 bopd of new pipeline capacity delivering crude oil to Cushing were added. Over the same period, only 400,000 bopd of new pipeline take-away capacity was added. During the next two years an additional 1,190,000 bopd of pipeline capacity for delivering crude oil from Canada and the mid-continent to Cushing is planned, but this is balanced by 1,150,000 bopd of planned new pipeline capacity to deliver crude oil from Cushing to the Gulf Coast. In addition, about 830,000 bopd of new pipeline capacity is planned to move crude oil from the Permian basin to the Gulf Coast, Fig. 5.
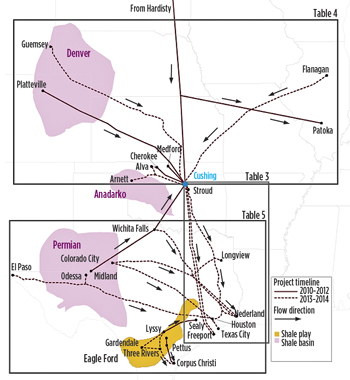 |
| Fig. 5. Map of recently completed and planned pipelines in and out of Cushing, Okla. and Eagle Ford shale play. |
FEDERAL GULF OF MEXICO
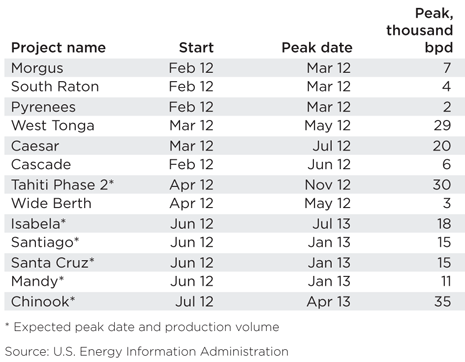
During 2012, oil production in the Federal GOM is projected to have increased from about 1.31 million bopd in January to about 1.39 million bopd in December (up 6%). This increase was driven by crude from 13 new deepwater fields, with a combined peak production of about 195,000 bopd, as well as the restarting of the Mad Dog field, which had been offline since April 2011, Table 6.
| Table 6. Federal GOM producing projects |
|
|
Also contributing to the increase in 2012 offshore oil production is the start-up of the Tahiti Phase 2 redevelopment project, in addition to deepwater fields that began production in 2011 but continued to increase during 2012. On an annualized basis, however, Federal GOM oil production for 2012 will likely be below its 2011 level, in part because of the production shut-ins that occurred during Hurricane Isaac. The hurricane also delayed development activities at several locations throughout the Gulf, pushing some late-2012 scheduled production starts into 2013.
EIA expects Federal GOM production to increase from an average 1.27 million bopd in 2012, to an average 1.39 million bopd in 2013. Much of that increase is the result of new projects that started producing in 2012 but did not reach peak production until late 2012 or early 2013. Adding to Federal GOM production in 2013 will be six new field start-ups with a combined peak production of about 45,000 bopd, and the Na Kika Phase 3 redevelopment project, Table 7.
| Table 7. Federal GOM developing projects |
|
.gif)
|
Projected Federal GOM production continues to increase in 2014, averaging 1.45 million bopd, as several relatively high-volume deepwater projects are expected onstream, including the Jack-St. Malo joint field development, Big Foot, Tubular Bells and Lucius. Also expected onstream during 2014 is the Atlantis Phase 2 redevelopment project. Combined peak oil production could be in the range of 300,000 to 350,000 bopd (although later-2013 scheduled start-ups may not reach peak volumes until 2014). The timing and volumetric contribution from these projects is based on project schedules, but actual project schedules and volumes will likely be different. Figure 6 shows historical and anticipated future deepwater field start-ups in the Federal GOM, along with oil production over the corresponding period.
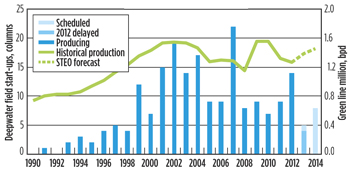 |
| Fig. 6. Federal GOM—deepwater field start-ups and total oil production |
ALASKA
EIA estimated that Alaskan oil production was 526,000 bopd in 2012. With the exception of 10,000 bopd of new production at the Point Thomson condensate field in 2014, no new oil projects are expected to begin operations in 2013–2014. Overall, Alaskan oil production is projected to decline in both years, and is projected to average 504,000 bopd in 2013, and 474,000 bopd in 2014. 
|
The authors
SAM GORGEN is an operations research analyst in the U.S. Energy Information Administration's Office of Petroleum, Natural Gas & Biofuels Analysis. His work includes modeling recent trends in the oil and natural gas exploration and production industry, and producing short-term production forecasts. He is also pursuing a Master of Science in Finance from George Washington University. samuel.gorgen@eia.gov
JOHN STAUB is the Oil and Natural Gas Exploration and Production Analysis team leader within the U.S. Energy Information Administration's Office of Petroleum, Natural Gas & Biofuels Analysis. He leads analysis and modeling of domestic and international resources, production and oil prices. John earned a BA in physics and philosophy from Concordia College, Moorhead, Minn., and an MPP from the University of Chicago’s Harris School of Public Policy. john.staub@eia.gov |
TANCRED LIDDERDALE manages the production of the Short-Term Energy Outlook for the Energy Information Administration. Before joining EIA in 1991, he worked for 12 years with Atlantic Richfield Co. in their petrochemical and refining operations, and foreign crude oil trading. He has a BS degree in Chemical Engineering from Georgia Tech, an MBA from the University of Houston, and a PhD in Economics from George Mason University. |


.png)


.gif)


