ANDY RAILTON, CAROLINE CLARK, Baker Hughes; and CELIA C. SANTOS, Sonangol P&P
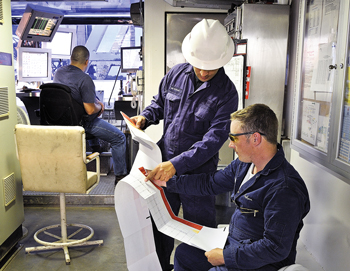 |
| Real-time LWD imaging data allows decisions to be made while drilling. |
|
The Pinda was the first producing reservoir in the N’Sano field of the Lower Congo basin offshore Angola. The reservoir’s mixed clastic and carbonate lithologies have been extensively characterized during the previous two decades. Nevertheless, understanding the reservoir has been challenging due to complex lithologies and the relationships of secondary porosity to permeability. Baker Hughes recently deployed logging-while-drilling (LWD) imaging technologies, in combination with real-time and post-processing methods, to deliver new insights into previously established interpretations of the reservoir.
High-resolution electrical LWD images were acquired in a development well drilled within the Pinda reservoir. By using the latest-generation StarTrak high-definition advanced LWD imaging, data of a quality never previously seen within the Pinda reservoir was acquired. In addition, real-time resistivity images were employed to identify intervals suitable for formation pressure testing and, thereby, improve operational efficiency.
The overall objective of the acquisition program was to effectively characterize the reservoir to the maximum possible extent given the technologies available. A key component being the imaging technology; therefore, a case study was created to document the various image types and their associated interpretations. These interpretations included structural dip computation, borehole quality indicators, sedimentological feature description, and characterization of fractures, faults and vugs as well as in-situ stress indicators. The LWD imaging data used in this study was obtained from the second well logged in a three-well infield drilling program.
PINDA DEVELOPMENT
The offshore Pacassa field is a NNW to SSE trending fault-bounded structure approximately 15 km long and varying from 1 to 2 km wide. In the south it splits into two separate structures termed the southwest and southeast legs. The thickness of the hydrocarbon interval varies from 120 m in the north of the field to approximately 350 m in the southwest leg. This is primarily due to changes in thickness of the reservoir interval due to erosion and structure. Prior to this campaign, there had been 46 wells drilled within the field, including sidetracks, of which 20 are producers, 15 are injectors, five have been suspended, and six have been abandoned. This field was discovered in March 1982. Production started initially under natural depletion until 1986, when water injection was started to counter declines in reservoir pressure. The southern half of the field was developed last and has been the most prolific area for production.
The Pinda is the principal reservoir within the field and consists of mixed carbonate and siliciclastic units deposited in a sabkha (Arabic word for salt flat) to shallow marine environment during the Upper Cretaceous period. The primary method of hydrocarbon production within the depleted reservoir is via an interconnected network of fractures and vugs contained within the carbonates with only minimal contribution from inter-granular porosity.
After geological and petrophysical studies were performed by various operators over the years, the reservoir was divided into three compartments: Upper Pinda, Middle Pinda and Lower Pinda. The main compartment discussed in this study is the Middle Pinda, which is generally considered to be the best producing reservoir.
LWD LOGGING
The primary objective for the Pinda reservoir logging was to perform a comprehensive formation evaluation with the secondary objective of logging formation pressures to assess pressure support from the adjacent injector wells. The well penetrated the Pinda reservoir with an 8.5-in. hole size at less than 20° hole inclination, beginning at the Upper Pinda Moita Seca unit and terminating close to the Albian Salt. The mud system employed was aerated “aphron” water-based mud used typically to drill through depleted reservoirs and other under-pressured zones.
The evaluation program for the reservoir section of the well was a combination of standard LWD and advanced wireline formation evaluation services. On the first well of the three-well program during the wireline logging phase, the wireline tools were lost in the hole and the well was subsequently abandoned. As a result, the only information available for evaluation was what was acquired from LWD. Given the wireline failure and upon considering the real possibility of similar problems on the subsequent wells, a decision was made by the operator to extend the LWD program to include the most advanced tools available for the second well. As a result, the LWD program for the second well consisted of the same sensors as the previous well but with the addition of StarTrak high-resolution electrical LWD imaging tool and the TesTrak formation pressure testing LWD tool.
Both the LWD and wireline acquisition programs of the second well were successful in acquiring all data as planned. This dual data set allowed a direct comparison to be made between the two methods in terms of data quality, efficiency of acquisition and overall service value. In particular, it was found that the electrical LWD imaging provided significant additional benefits in terms of identifying structural and sedimentological features.
FULL BOREHOLE COVERAGE
The StarTrak tool uses a shallow, focused, azimuthal laterolog measurement to generate high-resolution images with full borehole coverage, Fig. 1. The focusing and guard assembly is mounted on a stabilizer sleeve, which offers a managed standoff platform to optimize the position close to the borehole wall. Azimuth measurements are acquired in 120 separate oriented sectors providing an image of up to 0.25-in. x 0.25-in. resolution. The depth of investigation of the electrical measurement will vary with standoff and the drilling fluid to formation resistivity ratio; however, the value is approximately 0.5 in. The tool currently works only in conductive water-based drilling muds, where mud resistivity is in the range of 0.02 – 60 Ω-m at bottomhole circulating temperature.
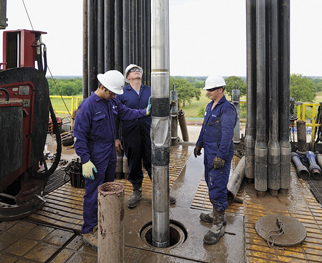 |
| Fig. 1. StarTrak tool provides full borehole imaging. |
|
Applications for electrical LWD imaging include optimizing well placement through reservoir navigation. For unconventional reservoirs, the tool can be used for structural and fracture system analysis to perform well correlation, cross-section construction, mapping and stimulation optimization. It may be used for sedimentary features analysis to generate a depositional environment model and core depth calibration. The electrical LWD images are useful for in-situ stress and borehole integrity analysis to predict potential borehole failure, to assess drill path alternatives and to optimize mud weight for maintaining rock mechanical stability. It can also be a less expensive substitute for conventional coring. In addition to high-resolution electrical LWD images several other image types were acquired. These included bulk density and gamma ray for basic structural dip interpretation as well as delta-rho images for a borehole quality indicator. In addition photoelectric effect images were acquired and analyzed to aid in the identification of vugs within the carbonate intervals. These additional image types do not form part of the following study.
IMAGE ANALYSIS
The high-resolution electrical LWD images were acquired in real time and memory for the 8.5-in reservoir section of the second well. A comprehensive study involving a detailed analysis of the electrical images was commissioned by the operator. The following key examples and findings have been extracted from this study. All images are from memory data and show the full 120-sector resolution.
Image quality. Mechanically, the electrical LWD imaging tool operated in accordance with its specifications and quality control analysis revealed no tool malfunctions. Image quality was good over the entire logged interval, although there were intermittent zones affected by image truncations. Drilling from a fixed platform meant that depth control was very good and the image truncations were attributed to high weight-on-bit, resulting in high stick/slip and lateral vibration issues. These truncations could not be corrected by additional time:depth smoothing during post processing.
Borehole quality. Much of the logged interval shows a weak-to-moderate hole spiraling artifact on the electrical images. This artifact hinders the geological interpretation at the local level. Generally, the borehole is in-gauge with minimal enlargement along the logged section. No definitive signs of borehole breakout occurred, although vertical fractures interpreted as drilling induced tensile fractures (DITF) were observed, Fig. 2.
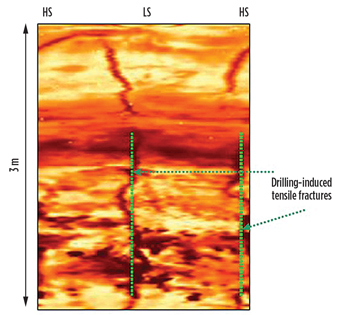 |
| Fig. 2. Drilling induced tensile fractures (DITF), electrical image (memory). |
|
Structural interpretation. Analysis of the electrical images focused on structural dip determination and review of image data for the presence and imaged character of fault and fractures. Structural dip was identified from well-bedded intervals that are assumed to have been originally horizontally stratified, e.g., shales, heterolithics and parallel-bedded sandstones. For this study, bedding features with a gamma ray value of greater than 80 API were selected. No differentiation of structural vs. depositional bed patterns was performed as further sedimentological details were required of regional palaeo-flow directions and depositional environment.
Sedimentological features. Overall, there appears to be a relatively complex sedimentological architecture over the logged interval with depositional dip variations hampering accurate structural dip definition. Many sedimentological findings were made throughout the logged interval, but in particular, the radioactive recif radioactive inferieure (RRI) unit found within the Lower Pinda stands out as being significant. The RRI shows elevated gamma response, which suggests that the lithology is argillaceous (illite-rich) with little or no potential for hydrocarbon production. Previously, wireline electrical images were unable to distinguish any laminated character to the RRI. However, the high-resolution electrical LWD images clearly showed that the majority of this formation could be more accurately characterized as comprising thinly inter-bedded sands and shales (<10 cm), Fig. 3.
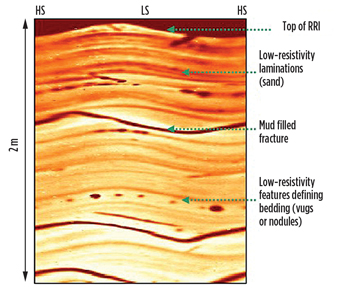 |
| Fig. 3. Upper section of RRI unit, electrical image (memory). |
|
Throughout the carbonate units of the logged interval there is often found local development of vuggy bedding, particularly within the dolomitic formation, Fig. 4. These take the form of vuggy bedding, but more commonly can be seen as a vuggy fabric.
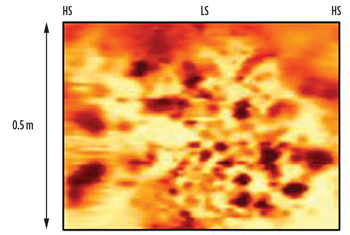 |
| Fig. 4. Vuggy fabric within the Pacassa formation, electrical image (memory). |
|
Fractures and faults. Overall, the Pinda reservoir is moderately fractured, but with many fractures that are too small or characterized by a fractured fabric rather than discrete planar features; therefore, they are not included in the final fracture orientation dataset or fracture counts. No definitive fault surfaces have been identified from the electrical images. A total of 165 fractures were categorized according to their observed electrical response on the images. A total of 31 high-angle features were classified, which may be representative of low-confidence fracture picks. There is a single dominant N-S fracture strike trend, comprising two fracture sets with mean dips of 71°/262° and 73°/82°.
In the example shown in Fig. 5, the highly resistive nature of many of the fractures can be discerned. Although not obvious from the image based upon the study of analogous field exposure from the Pinda reservoir, we often find that the fractures are filled with evaporate minerals. Fractures seen on electrical image logs cannot always be discerned as to whether they are of natural or drilling-induced origin. It is entirely possible that thermally-induced stresses could be the cause of many of the fractures, particularly in the hard rocks.
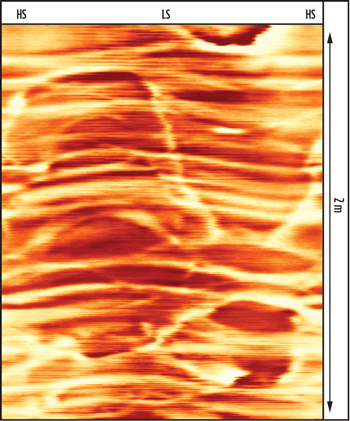 |
| Fig. 5. Example of resistive fractures, electrical image (memory). |
|
Present day in-situ stress indicators. As this is a subvertical well, identification of breakout and DITFs can provide important geomechanical data. An indication of the present day maximum horizontal in-situ stress direction can be made. Assuming a normal faulted regime, DITFs form in parallel and breakout perpendicular to this stress state. No definitive signs of borehole breakout occurred in this well, although a low confidence, possibly incipient breakout zone was identified, Fig 6. From available data, the maximum horizontal in-situ stress direction in this well is thus interpreted to be in the NW-SE direction.
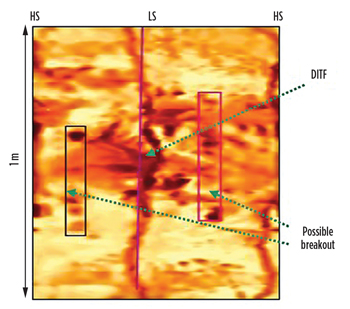 |
| Fig. 6. Example of a DITF showing subvertical conductive fractures 180° apart from each other and localized interval of possible incipient breakout, electrical image (memory). |
|
Intermittent, more incipient development takes the form of discontinuous chevron (en-echelon) fractures. These types of fractures form ahead of the bit and are due to excessive bit weight, Fig. 7. In addition, the fracture development is controlled by different lithologies with different mechanical properties and stress states.
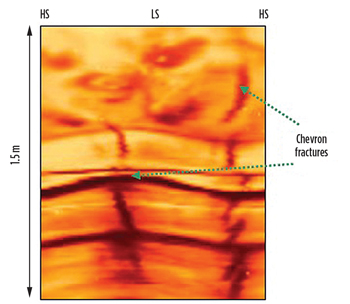 |
| Fig. 7. Discontinuous chevron fractures, electrical image (memory). |
|
Real-time resistivity images. A 32-sector image was transmitted in real time using high-speed mud pulse telemetry at 12 bps from the wellsite via a secure connection and to the Baker Hughes WellLink data services network. This service uses a standard web browser to provide restricted data access for the operator's geologists so they are able to display, interpret and make informed decisions regardless of their physical location. Despite the real-time images being only 32 sectors, they were of sufficient resolution to allow the identification of vugs, fractures and other hole irregularities that would otherwise have interrupted formation pressure testing. This technique resulted in a significant improvement in previously accepted sealing efficiencies with every one of the 15 attempted formation pressure test points maintaining a good seal to the formation.
CONCLUSIONS
This case study has demonstrated the value of high-resolution electrical LWD imaging and described new methods and techniques for both acquiring and interpreting the Pinda reservoir data. The relatively complex sedimentological architecture was described in detail and, in particular, the RRI unit was re-classified based upon the observation of thin permeable laminations. This encouraging result suggests the possibility that the RRI unit may be able to produce hydrocarbons. Further evaluation of this formation is planned through future wells.
A new method was also developed for using real-time images in the selection of LWD formation pressure points. In the highly fractured and vuggy Pinda reservoir, this technique delivered a 100% sealing efficiency during testing. The operator now considers the deployment of high-resolution electrical LWD imaging services as a key component for the future development of the Pinda reservoir. 
THE AUTHORS
|
 |
ANDY RAILTON joined Baker Hughes as a field engineer for both wireline and LWD services in 2001. After serving six years as the geosciences manager in Angola, Mr. Railton now works in Houston as a global account manager. He graduated in 1994 with a BSc degree from Imperial College of Science Technology and Medicine in London. / andrew.railton@bakerhughes.com
|
| |
|
CAROLINE CLARK is a senior region geologist for Baker Hughes Africa based in Aberdeen UK, specializing in borehole imaging applications with 21 years of oil industry experience. Ms. Clark graduated with a BSc (Hons) in geology from Bristol University in 1989, a MSc in applied sedimentology from Reading University in 1990 and an MBA from the Robert Gordon University in 2007 with research focus on geoscience knowledge management. / caroline.clark@bakerhughes.com
|
| |
|
CELIA SANTOS is a senior petrophysicist for Sonangol P&P based in Luanda, Angola. / celia.santos@sonangolpp.com
|
|


