Reinterpretation of missing sections has resulted in downward reserve revision, location of a bypassed pay zone, a new pressure support scheme and a major discovery—each with significant monetary implications.
Jean-Yves D. Chatellier, Talisman; and Maria Eugenia Rueda, Statoil
In structurally complex areas, seismic interpretation can be misled by well data wrongly interpreted. A common approach in the oil industry privileges well data in a seismic interpretation. A major problem arises when an interpretation is treated as data, such as when a normal fault is assumed to account for any missing section observed in the data.
This article will present a series of examples, mostly in Venezuela, from various structural settings in which missing sections cannot be attributed to normal faulting. Tools and key observations will be presented that can easily and quickly demonstrate the inadequacy of some normal fault interpretations.
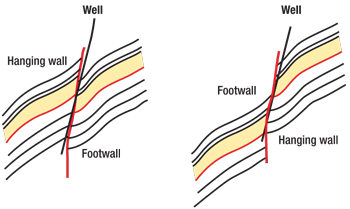
A first step before any hypothetical geological model should be to make sure that the missing section is not linked to a simple case of geometry between a fault and the borehole trajectory, Fig. 1. The remainder of the article will focus on four main types of geological occurrences where missing sections are not associated with normal faulting.
 |
|
Fig. 1. Examples of cases in which the geometry of the borehole with respect to a fault could be responsible for misinterpretation of the fault type: a missing section associated with a reverse fault (left) and a repeat section associated with a normal fault (right).
|
|
SAME LEVEL IN NEIGHBORING WELLS
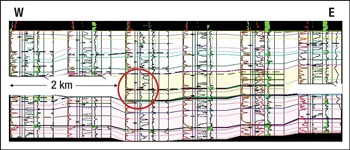
Probably the most common and most easily recognizable normal fault misinterpretation is when there has been some synsedimentary tectonic activity; one key observation in such cases is the existence of missing sections laterally equivalent to massive blocky sands. Log facies maps are very effective at identifying such occurrences because large-scale rhombic patterns are commonly observed; however, a fairly large number of wells are needed to make a meaningful map. The missing sections are found on horst blocks, whereas the thickest and best sands are found at the very edges of these blocks. The sands are commonly blocky (identical gamma ray values), indicating a rapid aggrading sedimentation. Paleosoils are sometimes associated with this kind of missing sections. Figure 2 shows an example from the Oligocene in Venezuela’s El Furrial Field.1
 |
|
Fig. 2. Cross-section of Oligocene sands in El Furrial Field showing a missing section associated with synsedimentary tectonic activity.
|
|
The same pattern of missing sections and massive blocky sands is commonly found in neighboring fields. Misinterpretation of this type of missing section often leads to an inadequate development scheme aimed at sand units that do not exist and to overestimation of hydrocarbon reserves, as the sands are thin or not present on the horst blocks.
STRIKE-SLIP SETTINGS
Missing sections in strike-slip settings will be illustrated by a historical review of the VLA-31 Block from Venezuela’s Lama Field. The block is limited to the east by the famous Icotea Fault, a major strike-slip fault in the middle of Lake Maracaibo.
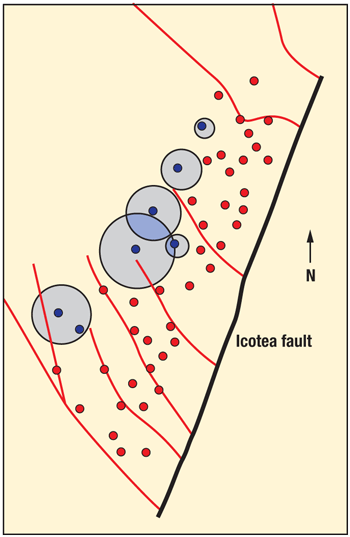
During the drilling and development of the block, missing sections were observed in nine wells and interpreted as normal faults. (One questionable repeat section was nevertheless found in one well in the northeastern part of the field.) A water injection scheme was then designed to maintain the reservoir pressure, and wells were drilled to the west, downdip from the producing wells, Fig. 3.
 |
|
Fig. 3. Map view showing 41 producing and six injection wells, along with the original interpretation of missing sections in the strike-slip setting of the VLA-31 Block in Lama Field.
|
|
Reservoir pressure had been declining despite water injection, which therefore seemed to be totally inefficient. At the time, there was no 3D seismic on the VLA-31 Block. The geology was revisited in great detail; the positions of all of the previously interpreted faults were confirmed, and no new repeat section was found. However, a multiple Bischke plot analysis (MBPA) on all the wells indicated that these cutouts could not be attributed to normal faults.2–3
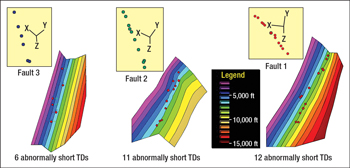
The first step toward finding a solution came from the observation that 29 out of 53 wells were stopped short because of drilling mechanical problems. A 3D display of all of these abnormal total depths revealed the existence of three well-defined planes, Fig. 4. A further integration of all the data indicated that all of the fault cutouts observed in the wells were on these three newly interpreted planes. The geometry of these planes with respect to the Icotea fault (to the east) is indicative of synthetic Riedel shear-type faults associated with a major strike-slip fault.
 |
|
Fig. 4. Contour maps of three major reverse faults constructed with abnormal well termination data only.
|
|
The new interpretation was validated by sedimentology4 and by geostatistical methods.5 The crucial first piece of the puzzle was the identification of a thin, blocky sand that was found in every well and was repeated in each well where missing sections had been previously interpreted. This ubiquitous unit had been interpreted as a tempestite (storm deposit). The second piece of the puzzle was the realization that the sequence overlying this storm deposit was either coarsening upward or fining upward and corresponded to either a bar or a channel; both facies are nearly coeval, having bars locally cut by the channels.
Geological and sedimentological studies indicated an average displacement of
1 km along the newly identified faults. The geostatistical modeling confirmed the relative size of the lateral shift of facies.5 These faults were thus reinterpreted as reverse faults with some oblique slip component. The interpretation of a Riedel shear system was confirmed by a newly acquired 3D seismic survey.
The repeated units had not been recognized until this study because the facies of the repeated section (above and below the fault) were from different sedimentary environments and had very different gamma-ray characteristics (coarsening up versus fining up).
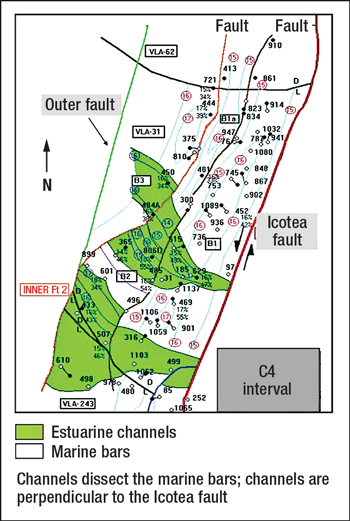
The newly interpreted faults are now more or less north–south, a 90° shift from the original interpretation, Fig. 5. As a consequence, the pressure support scheme had to be revised, because the original water injection wells were separated from the producing reservoirs by large sealing faults.
 |
|
Fig. 5. Map view of the new interpretation of the missing sections in the VLA-31 Block, with Misoa C4 sands. The newly interpreted faults are roughly north–south, a 90° shift from the original interpretation.
|
|
AVERAGE-ANGLE FAULTS
Paucity of wells can lead to mistakes in fault interpretations. Whereas any three fault cutout points will create a perfect fault plane, the link between these points is totally hypothetical; however, the map that is generated using the fault throw values may indicate if these points are indeed on a single fault plane. Thus, at least four wells are needed to define a reliable plane, but in order to propose such a plane, the geologist would need to have good 3D seismic and 3D visualization software, or would need to have spent time studying the contour maps. In an example from Venezuela’s Santa Barbara Field, the simple analysis of the fault cutouts from a contour map can provide the solution. (Contour maps are in every geologist’s tool box.)
A problem identified in the hydrocarbon mapping of one area of Santa Barbara Field required a revisitation of the existing fault interpretation, which consisted of five individual normal faults in five neighboring wells.
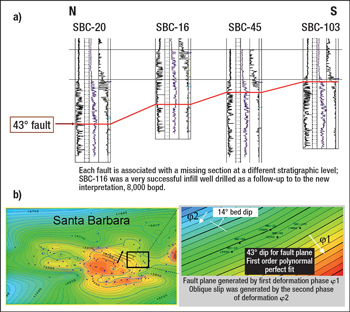
Each well had only one interpreted fault; the contour map of the fault cutout revealed a perfect plane passing through these points, Fig. 6. The dip of the fault was 43°, an unusual angle for either a normal fault or a reverse fault. The fault dip direction was in line with the regional compressive stress of the area, but it was oblique with respect to all of the sedimentary layers of the hanging wall. That discrepancy is commonly indicative of a reactivation of a pre-existing fault invoking some oblique slip. Figure 7 summarizes the existence of missing sections associated with oblique slip (simple strike-slip motion has been used in the diagram for simplicity’s sake).
 |
|
Fig. 6. Missing sections on a reactivated reverse fault in Santa Barbara Block 1: a) projected cross-section showing a fault plane connecting various fault cutouts; b) fault plane contour map of the same plane (note the 43° dip and the obliquity with the overlying strata).
|
|
 |
|
Fig. 7. Simple model based on the Santa Barbara example. The dip of the fault is 43° and the dip of the overlying beds is 14° to the northeast.
|
|
Whereas each of the previous infill wells had been producing oil at a rate of about 2,500 bpd, a new infill well (SBC-116) was proposed and drilled based on the new geological model. This new well matched exactly the prognosis for all of the layers from either the hanging wall or the footwall; more importantly, it produced 8,000 bopd, since it was tapping a virgin reservoir compartment.
Such faults with “in-between” dip angles are commonly missed in a seismic interpretation, but they may exhibit an interesting seismic signature: High amplitude that is sometimes found below such reactivated fault planes is a feature of trapped hydrocarbons below a sealing fault. The same kind of fault has been identified in the eastern part of all three main fields of the El Furrial trend (Furrial, Carito and Santa Barbara).
SIMILAR SUBSEA DEPTH
The most commonly overlooked structural pattern linked to missing sections relates to detachment faults and very low-angle thrust faults (mostly low-angle backthrusts). They are not commonly identified, though they arguably should be the easiest to spot since they invoke stratigraphic problems at very similar subsea depths and even sometimes at the exact same subsea depth.
This type of missing section will be discussed using an example from the northwestern part of Santa Barbara Field. The most obvious and most important geological observation in this case was the enormous missing section that was seen in two wells: up to 2,000 ft of missing stratigraphy. In fact, because the dipmeter in well SBC-90 indicated a 60° dip in the footwall, the missing section (fault throw) could have been close to 4,000 ft in length.
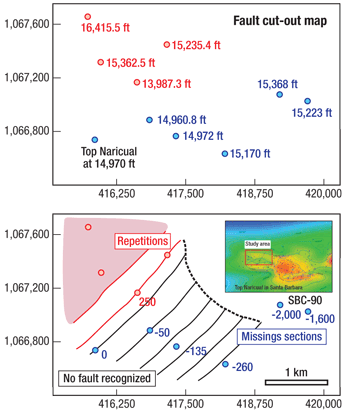
Figure 8 provides various bird’s-eye views of the major fault that was interpreted. Note that all the stratigraphy was done by the same geologist for consistency’s sake; he identified one fault in every well except for one. Prior to this study, no fault planes of any kind had been proposed despite the numerous studies and interpretations by internal and external structural geology groups.
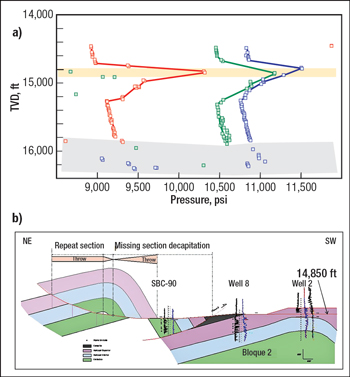
The wells and their respective faults can be grouped into three categories: the ones with very large missing sections (north of the dotted line in the large lower map of Fig. 8), the ones with small missing sections (blue dots on the map with a fault throw between 50 and 250 ft), and the ones with repeat sections (red dots). Whereas the hydrocarbon column in Santa Barbara Field starts at 12,500 ft and locally can be found down to 20,000 ft, the major faults in the area of interest are all around 15,000 ft subsea. This narrow depth range led to the hypothesis of one single fault plane; the idea was further supported by repeat formation test (RFT) pressure data, Fig. 9a. The abnormally high pressure values and the backward trend below these indicate a structurally damaged zone that would have been induced by a backthrusting/detachment mechanism.
 |
|
Fig. 8. Oil rigs as a percentage of the active rig count.
|
|
The cross-section in Fig. 9b summarizes some of the most relevant geometric elements and the lateral variation in fault throws. The following elements have been crucial in the development of the proposed solution. First, there were enough wells to understand the complexity of the footwall below the hypothetical fault plane (bird’s-eye view). The second element was the gradual change from 260 ft to 50 ft missing; the well with no apparent fault is in line with this gradual change in fault throw. Third, the two wells with the same amount of repeated section (250 ft) offered some support for the fault-throw contour exercise. Finally, the well with a repeated section of 510 ft was a troublesome outlier, and it had been suggested that this well should be omitted from the study. In fact, this well provided the final clue pointing to a well-behaved fold with a massive flank exhibiting the same geometry above and below the backthrust plane. The reason for the nearly constant fault throw relates to the lack of dip change between the footwall and the hanging wall.
 |
|
Fig. 9. Engineering evidence of a detachment plane and the final geological model: a) repeat formation test data characteristic of isolated compartments created by a detachment at a vertical depth of 14,850 ft; b) a northeast-to-southeast cross-section outlining the tectonic klippe that was transported toward the northwest (note the fault throw gradual change within the klippe).
|
|
Early in the study, it was determined that a large part of the field was missing, and the search was focused toward the south of Santa Barbara Field because the thrusting came from the north. The new interpretation of the fault as a single fault plane indicated that the missing klippe had moved to the north—against the thrusting direction. This is in line with the new vision of the area that locates the field near a major triangle zone—Tacata Field to the west. A very large hydrocarbon-filled extension of Santa Barbara Field has, thus, been discovered. A seismic anomaly that was previously thought to be due to a velocity artifact was in fact real.
CONCLUSIONS
Missing sections are usually associated with normal faulting, but well-defined counterexamples do exist, and in fact are much more common than thought. Four types of such occurrences have been described, three of which invoke lateral gliding along a reverse fault, a low-angle thrust or a detachment.
Visualization in 3D of the fault cutouts of a few wells is the most effective and quickest way to identify problematic structural interpretations, especially when the fault plane corresponds to a detachment or to a low-angle backthrust. Some of the flags that need to be kept in mind in any structural interpretation are fault cutouts at the same stratigraphic level and fault cutouts at similar subsea depths. Hydrocarbon column problems or enigmatic pressures are secondary types of evidence that can help confirm or reject any proposed interpretation. They can also push the geologist to a review of a structural model.
The examples described here have been linked to a reserve revision, a large bypassed pay zone, a new pressure support scheme and a new major discovery. The monetary implication in each of these cases is big, highlighting the importance of challenging the “missing section equals normal fault” paradigm. 
ACKNOWLEDGMENTS
This article was prepared in part from AAPG 727472 presented at the AAPG Annual Convention held in New Orleans, April 11–15, 2010. The authors thank PDVSA Oriente and PDVSA Intevep for permission to present these findings.
LITERATURE CITED
1 Uroza, C., “The stratigraphical significance of the paleosoil levels in the Oligocene of the Furrial Field, Northern Monagas, Maturin sub-basin, Venezuela,” core workshop presented at the Virtual Sedimentology Congress, February 2002.
2 Sanchez, R., Chatellier, J-Y., de Sifontes, R., Parra, N. and P. Muñoz, “Multiple Bischke Plots Analysis, a powerful method to distinguish between tectonic or sedimentary complexity and miscorrelations; methodology and examples from Venezuelan oil fields,” Memorias del Primer Congreso Latinoamericano de Sedimentología, Tomo II, Venezuelan Society of Geologists, November 1997, pp. 257–264.
3 Chatellier, J-Y and C. Porras, “The multiple Bischke plot analysis, a simple and powerful graphic tool for integrated stratigraphic studies,” AAPG Search and Discovery Article 40110, 2004.
4 Chatellier, J-Y., de Sifontes, R., Mijares, O. and P. Muñoz, “Geological and production problems solved by recognizing the strike slip component on reverse faults, VLA-31, Lake Maracaibo, Venezuela,” SPE 56558 presented at the SPE Annual Technical Conference and Exhibition, Houston, Oct. 3–6, 1999.
5 Porjesz, R., Chatellier, J-Y., Sanchez, R., Sifontes R. and P. Muñoz P., “Geostatistical methods to validate and choose between sedimentological and structural interpretations in VLA-31 of Block 1, Lake Maracaibo,” Memorias del Primer Congreso Latinoamericano de Sedimentología, Tomo II, Venezuelan Society of Geologists, November 1997, pp. 181–190.
|
THE AUTHORS
|
 |
Jean-Yves Chatellier has been in the oil industry since 1980, with a focus on multidisciplinary integration and data mining. He holds a PhD in tectonics from Pierre and Marie Curie University in Paris, which he earned after receiving degrees at the University of Lille and the University of Calgary. Dr. Chatellier worked for Elf Aquitaine, Petroconsultants and Shell, and was Senior Geology Advisor for PDVSA in Venezuela for seven years before moving to Canada to work as a consultant. He is now a Senior Geoscientist for Talisman Energy.
|
|
 |
Maria Eugenia Rueda has 12 years of experience in the oil industry. She earned a BSc degree in geophysics from Simon Bolivar University in Venezuela and an MSc degree in petroleum geology from the University of Aberdeen in Scotland. She began working for PDVSA in 1998 as a Seismic Interpreter and spent the next five years working on different oil production fields. She has been working for Statoil for the last six years, first as a Production Geophysicist in the North Sea and now in geomodeling focused on Statoil international assets. |
|


