Low-frequency drillbit seismic while drilling (Jul-2009)
A low-frequency sparker source within the drillbit is used for seismic while drilling, enabling real-time imaging in deep HPHT wells.
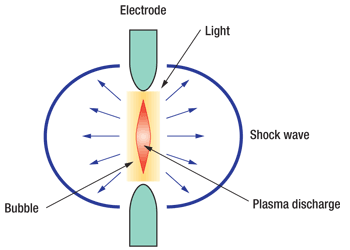
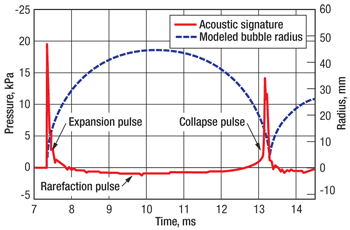
A low-frequency sparker source within the drillbit is used for seismic while drilling, enabling real-time imaging in deep HPHT wells.Robert P. Radtke, Technology International, Inc.; and Mandy Cepeda, RMOTC An otherwise high-frequency sparker source can be incorporated into a drillbit for seismic while drilling to generate selectable low frequencies (< 40 Hz) for various seismic applications. The low-frequency source, capable of creating selectable mid-band frequencies of 1–20 Hz, enables real-time imaging in deep (over 15,000 ft), high-temperature (150°C), high-pressure wells for geosteering, accurate seismic hole depth, accurate pore pressure determinations ahead of the bit, near-wellbore diagnostics with a downhole receiver and wired drill pipe, and reservoir model verification. INTRODUCTION Drillbit Seismic While Drilling (SWD) provides real-time measurements that correspond to data normally obtained by conventional Vertical Seismic Profiling (VSP) or reverse VSP methods. In these methods, seismic data is obtained with the receiver in the drillstring and the source at the surface (VSP), or a downhole seismic source with receivers deployed at the surface (reverse VSP). Drillbit seismic methods use downhole acoustic energy without interruption of the drilling process. Conventional VSP surveying techniques use wireline systems with recording tools in the borehole. Interruption of the drilling process increases operating costs and risks. Drillbit SWD helps overcome the higher costs and risks, and provides the geophysicists and drillers with valuable information to optimize drilling efficiency and to steer to the target with the ability to predict pore pressure ahead of the bit and verify reservoir models in real time. In this way, the renewed application of drillbit SWD by the petroleum industry can offer an economic as well as technological advantage: lower costs when compared to conventional VSP, increased safety and cost savings by detecting unexpected increased pore pressure ahead of the bit, the ability of operators to verify pre-drill reservoir models to “see” and steer toward more optimal targets, and new operational capabilities when drilling HPHT wells. To create a controllable low-frequency sparker seismic source, it was necessary to study sparker designs to learn how to maximize, sparker efficiencies to couple to, and transmit through rock. It was also necessary to study mechanisms for coupling the gas bubble expansion and contraction to the rock, the effects of fluid properties and dynamics, linear and nonlinear acoustics and imparted-force directionality. After extensive modeling and laboratory testing, field tests were first performed at the University of Texas’ Devine Seismic Test Site. Finally, with the design and manufacture of a sparker drillstring tool, the low-frequency sparker was successfully tested at the US Department of Energy’s Rocky Mountain Oilfield Testing Center (RMOTC) field test site near Casper, Wyoming. TECHNICAL PATH Initial testing of the sparker acoustic source was performed in a laboratory sample rock environment. During this first series of tests, various high-frequency sparker configurations were measured, and the best configuration was selected for field testing at the Devine test site near Hondo, Texas. While surface recordings at Devine showed that at 1,800 ft, the sparker would provide sufficient surface signal strength when powered with 2,200 joules, it was apparent that extreme power levels would be necessary to operate at depths greater than 15,000 ft. Thereafter, flow tests were performed to determine if power could be enhanced when the sparker is placed in the mud flow of a drillbit. The project then investigated sparker bubble-formation physics. More laboratory tests were performed, again with the desired sparker configuration in sample rock, to generate lower frequencies and, thus, less acoustic attenuation in rock, at sensible power levels. Results showed that multiple pulsing of the sparker input power resulted in 1–6-Hz peak frequencies. With a fraction of the power used for the Devine wireline high-frequency sparker test, the low-frequency sparker proved to be capable of operating on a drillstring as a downhole source during the RMOTC field tests. RESULTS—HIGH-FREQUENCY LAB TEST A single sparker pulse creates a gas bubble, Fig. 1a. Then, milliseconds later, the bubble collapses, Fig. 1b.
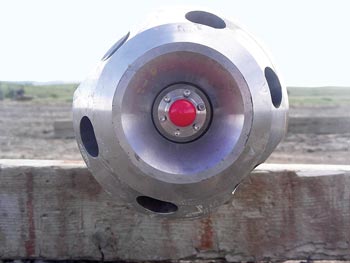
An electrical spark device was used as the seismic sound source for tests conducted with the device suspended in a 16-in.-diameter by 40-in.-long cylindrical in a white Sierra granite rock sample and an 8½-in. hole bored in the center. The sparker was suspended at different heights above the bottom of the hole in 2 ft of fresh tap water. The test was done to demonstrate that the sparker energy was in agreement with both a calibrated hydrophone suspended in the water and the values measured with vertical and horizontal accelerometers affixed outside the test rock. Output measurements of the hydrophone and accelerometer were then compared to theoretical values for a sparker operating in 2 ft of water. Acoustic data was collected at a transmit energy level of 400 joules. The peak amplitude out of the hydrophone was 248 dB (with reference to 1 µPa). Higher levels were not measured with the hydrophone for fear of damaging it. However, accelerometer measurements were made with input power levels up to 2,200 joules. When an underwater high-energy spark impulse occurs, a bubble is formed that expands outward until the pressure inside the bubble reaches ambient pressure, then the bubble collapses. The process produces two high-energy pressure pulses, one at the initial impulse and one upon bubble collapse. The time between these two pressure pulses is referred to as the bubble period. The bubble period is a function of the energy involved in the initial impulse and the operating pressure. For the test conditions in the laboratory with a 400-joule sparker in 2 ft of water, the measured period of 12 ms agreed with the theoretical predictions. This double impulse produces a very broad acoustic spectrum that peaks at a frequency that is about the reciprocal of the bubble period. Spectrum analysis of the received signal from the horizontal accelerometer output for the 400-joule pulse agreed with theoretical predictions. Tests were made to compare the output of the two accelerometer outputs with the sparker fitted with different coupling devices. Specially shaped couplers provided more vertical accelerometer output and, thus, more directionality than the plain sparker. The laboratory tests showed that the sparker performed as theory predicts and validated the model. Therefore, this model can be used to predict the performance in field tests with confidence. The calculations indicate that a 2,200-joule sparker operating at 1,800 ft of depth at the Devine test site could produce sufficient power over a bandwidth of 50–1,111 Hz to be detected on the surface to a range of 0.5 mi. RESULTS—HIGH-FREQUENCY FIELD TEST An optimized high-frequency sparker configuration was tested on a wireline at the University of Texas’ Devine test site to demonstrate the potential of the acoustic source as a downhole seismic source in known lithology to a depth of 1,800 ft. Three wells were used for these tests. Wells 2 and 4 are about 363 ft apart and are steel cased to a depth of about 400 ft and cased with fiberglass to 3,000 ft. A shallow (150 ft) steel-cased hole next to Well 2 was also used. Testing began with the acoustic source at the bottom of the shallow well (about 150 ft), with a hydrophone in Well 4 at the same depth, and proceeded to 1,800 ft. A single hydrophone was used to collect cross-well data in each formation type present at the Devine test site. Also, two surface seismic arrays were deployed orthogonally 0.5 mi out to receive and record direct transit through and reflected signals from the various formations. Seven tests were run with the acoustic source in the shallow hole. A single hydrophone was lowered in Well 4 to depths of 80, 110, 622, 1,200, 1,590 and 1,800 ft, roughly in the middle of each layer, to record cross-well seismic signals. Each test was repeated eight times. The original intent was to lower a 10-hydrophone string in Well 4 to record the cross-well coupling at 10 depths simultaneously, but the 10-hydrophone string was not available. Therefore, a single hydrophone was lowered to the aforementioned depths. Test results show the direct arrival energy from the acoustic source in the shallow well to the hydrophone in Well 4. Only limited cross-well data was collected with the acoustic source at the 1,800-ft depth because the tests were terminated during this run due to equipment problems. The sound velocity of the direct arriving ray was calculated by dividing the slant range distance by the measured seismic travel time. The calculated velocities agree very closely with archival data furnished by the Bureau of Economic Geology at the University of Texas at Austin. The shallow well tests demonstrated that the hydrophone detected the direct-path cross-well signal to depths of 1,590 ft. This demonstrated the utility of the acoustic source for cross-well seismic operations. Seven additional tests were conducted with the acoustic source lowered to various depths in Well 2. The single hydrophone was lowered to the same depths in Well 4, to record cross-well seismic signals. Simultaneously, two orthogonal digital surface arrays recorded the seismic signals received at the surface. Cross-well coupling was measured at the 622-ft depth but was not recorded at the deeper depths. Cross-well coupling worked between the shallow hole and Well 4, and was expected to work just as well from Well 2. One explanation of why the cross-well coupling was not measured at the deeper depths might be due to sound ray refraction, a problem typically encountered in cross-well tomography. Due to sound ray refraction, when the acoustic source and a single hydrophone are placed at the same depth it is possible that the signal will not be received. A very small change in density creates a velocity gradient, which bends the sound ray upward about a radius that can force the horizontal ray to miss the hydrophone. If the 10-hydrophone string, as previously planned, had been available there may have been a different result, because there would have been hydrophones above and below the acoustic source depth. This was not known at the time, and, consequently, all data was recorded with the hydrophone set at the same depth as the acoustic source. Digital surface sensor data plots showed sensor output on a typical seismic plot with the frequency of the received signal from 0 to 500 Hz. Data below 100 Hz was contaminated by noise from the diesel generator operating near the recording trailer. The anti-aliasing filter rolls off above 350 Hz. Therefore, useful data is in the frequency band from 100 to 350 Hz. Visual inspection of frequency response showed that the signal in this area is cleaner than data outside this band. The digital surface sensor data demonstrated that the acoustic source signal could be received from 1,800-ft depths. The horizontal range was limited because the low frequencies (less than 100 Hz) were obscured by the diesel power generator noise. The results of the deep well test with the surface array were encouraging. The acoustic source demonstrated that it generated a pulse that could be received with the surface array from a depth of 1,800 ft, verifying predicted performance. RESULTS—LAB FLOW TEST An initial series of tests were performed to understand the fluid dynamics of spark-generated steam bubbles in a pressurized, flowing fluid. These tests were conducted in a specially built flow loop. The purpose of the test was twofold: to confirm that spark-induced bubbles can be generated under pressurized, flowing conditions without destroying the hardware involved, and to determine the effects of ambient pressure and fluid velocity on the measured pressure pulses resulting from the expansion and collapse of the bubbles. The first series of tests were run in straight sections of 1½-, 2- and 2½-in. steel pipe, to investigate the effects of creating spark-generated bubbles within the confined space of a straight tube of various diameters. The second series of tests were run with different nozzle and orifice configurations. The spark plug was placed upstream of the nozzle or orifice in some cases, downstream in others, with the intent of investigating the effects of sparker placement relative to a drilling fluid jet stream. The tests were run with ambient pressures ranging from 17 to 58 psig and mean fluid velocities ranging from 0 to 34 ft/sec. A conventional spark plug, threaded into the side of the test section, was used with a standard charge amplifier to generate the sparks. Spark plugs function well for test conditions, but do not have the life or efficiency required for a seismic application. Pressure gauges both upstream and downstream of the spark plug were used to measure the resulting pressure pulses. Bubbles were successfully generated and recorded under ambient pressures that would have created spherical bubbles ranging from 1.2 to 2.4 in. of diameter in open water. Pressure pulses as high as 510 psi were measured 9 in. away from the spark during bubble expansion. Pulses up to 400 psi were measured during bubble collapse. The results obtained in these tests provided significant insight into the bit hydraulic and mechanical design parameters for a drillbit incorporating a sparker for drillbit SWD applications. In particular, the following conclusions have been reached. Spark-induced bubbles can be generated in water within a confined, pressurized space, either with or without fluid flow, and it can be done at power levels low enough to avoid destruction of the hardware involved. Pressure pulses resulting from the expansion and collapse of the bubbles produce fluid pressures of extremely short duration (10–100 ms) and several hundred psi in magnitude nearly a foot away from the sparker. Such pressure pulses should act as an effective acoustic source for downhole applications. Bubble lifetime was found to decrease with ambient pressure, as predicted by the modified Rayleigh-Willis equation for a spherical bubble, with significant effects found due to the confining effect of the tube and any nozzles or orifices near the bubble during expansion. Bubble lifetime was found to generally increase with fluid velocity and to increase with a reduction in test-section diameter. This is thought to be a geometric effect, where a long elliptical bubble apparently takes longer to collapse than a spherical bubble of the same volume. Bubble-expansion and bubble-collapse pressure peaks were found to increase with a reduction in test-section diameter. This could be because the pressure peaks generated at the bubble wall are geometrically attenuated to a smaller degree in a smaller tube. In the presence of a nozzle or orifice, the bubbles were found to collapse with greatly reduced peak pressures. This may be due to distortion of the bubbles in the reduced fluid cross-section, which causes them to collapse asymmetrically and with less concentrated force than either a spherical or elliptical bubble. Initial ambient pressure or the velocity of the fluid did not affect the bubble-expansion and bubble-collapse pressure peaks in both the straight-tube and nozzle/orifice tests. RESULTS—LOW-FREQUENCY LAB TEST A technique to generate a low-frequency seismic signal using spark gap technology was first developed. In the sparker borehole simulator, a sparker control method was developed that generated low-frequency (1–6 Hz) seismic signals with sparker technology at power levels useful for drillbit SWD. The acoustic frequency spectrum measurements were conducted in an enclosed rock chamber. A strain gauge accelerometer was attached for axial measurements at the bottom of the rock, and horizontal measurements were made with an accelerometer attached to the side of the rock in line with the sparker. The frequency spectrum measured was of a peak waveform with a very broad spectrum. Electrical feed-over peaks from the spark are present at the start of the accelerometer signal. This sharp peak also distorts the measured spectrum. In spite of these known distortions, these tests showed that the low-frequency technique produces the desired low-frequency (1–6 Hz) seismic signal. RESULTS—RMOTC FIELD TEST The main objective of the field test of a deployable drillstring sparker tool was to fire and record the seismic energy generated by the low-frequency sparker downhole source in a wellsite environment. The field demonstration used a prototype 26-ft-long by 8-in.-diameter sparker tool (Fig. 2) at RMOTC.
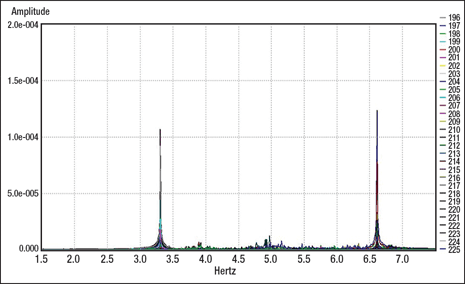
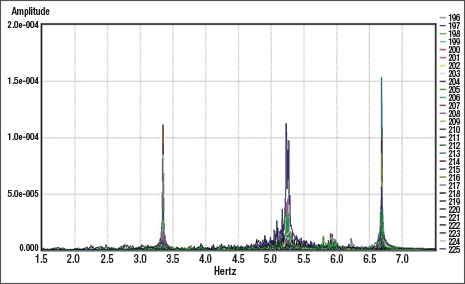
The well was lined with casing to about 650 ft, with open hole to 5,665 ft. However, due to hole conditions, tests could only be conducted to 4,000 ft. Directly below casing was the Steele Shale Formation, containing a number of thin sandstone channels, the Sussex and Shannon sands. The deeper sandstone formations were the First, Second and Third Wall Creek, the Dakota and the Lakota. The seismic recording system monitored and recorded the seismic signal generated by the downhole low-frequency sparker. Two orthogonal receiver lines were laid out close to the wellhead location. Each of the two lines employed 48 receivers at 55-ft spacing. The lines crossed close to the surface total depth location of the borehole at about 500 ft west of the wellhead location. The seismic data were recorded in SEG-Y format, and reformatted for use of a seismic processing software package. The rig environment, of course, contained many sources of background noise including mud pumps with a 3.3-Hz and a 6.6-Hz frequency as a function of the 350-gpm pumping rate, Fig. 3a. The rationale was to program the low-frequency sparker at a low peak frequency (2 Hz), since it was assumed to be below the bandwidth range of the background noise. Seismic records show that no coherent energy was being recorded below 3 Hz. With the receiving sensors and recording system damping all signals below 3 Hz, it was not possible to see the 2-Hz signal. However, it was discovered that the 2-Hz signal modulated with the 3.3-Hz mud flow signal, creating the combined signal of 5.3 Hz, Fig. 3b.
When used in the drilling mode, the energy generated by the low-frequency sparker would normally have to compete with all the coherent noise energy generated at the rig site while the pumps were running and the drillstring rotating. However, with high-voltage electrical energy stored in the capacitors, the sparker can be programed, for example, to generate a 4-Hz peak signal every 20 sec. with the pumps turned off. The additional energy at the drillbit may increase ROP. CONCLUSIONS Tests in both the lab and the field showed that low frequencies can be generated by an otherwise high-frequency sparker. The low-frequency drillbit SWD system will not interfere with the drilling process, thus avoiding unacceptable cost implications. In deep HPHT wells, low-frequency drillbit SWD can provide “look ahead” imaging with a selectable and surface-adjustable power and frequency source that can be fired when the pumps are turned off. With capacitors rated for 15,000 feet and deeper and 150°C, charged with only a 13-hydraulic-horsepower turbine alternator, the sparker can create low-frequency peak spectra (1–20 Hz) that reflect from formations ahead of the bit to the surface and adjust to higher-frequency spectra (40 Hz–10 kHz), for near-wellbore real-time diagnostics or downhole recorded information. The new low-frequency sparker source output is independent of depth and pressure. The unique sparker control system can adjust power and frequency as needed from the surface to meet varying demands of depth, rock properties and other geological variances. Velocity profiles can be created in real time at the rig site for employing existing service company pore pressure diagnostic capabilities. The low-frequency sparker can be fired when pulling out of the hole for seismic data verification. New hydrocarbon reservoir and salt dome seismic applications can be performed with increased control of drillbit SWD source spectra. Static fluid laboratory rock tests showed that bubble formation and collapse were consistent with the Rayleigh-Willis formula for bubble dynamics, while flow tests showed pressure pulses higher than predicted.
|
||||||||||||||||||||||
- Coiled tubing drilling’s role in the energy transition (March 2024)
- Shale technology: Bayesian variable pressure decline-curve analysis for shale gas wells (March 2024)
- Using data to create new completion efficiencies (February 2024)
- Digital tool kit enhances real-time decision-making to improve drilling efficiency and performance (February 2024)
- E&P outside the U.S. maintains a disciplined pace (February 2024)
- Prices and governmental policies combine to stymie Canadian upstream growth (February 2024)
- Applying ultra-deep LWD resistivity technology successfully in a SAGD operation (May 2019)
- Adoption of wireless intelligent completions advances (May 2019)
- Majors double down as takeaway crunch eases (April 2019)
- What’s new in well logging and formation evaluation (April 2019)
- Qualification of a 20,000-psi subsea BOP: A collaborative approach (February 2019)
- ConocoPhillips’ Greg Leveille sees rapid trajectory of technical advancement continuing (February 2019)

