INFORMATION TECHNOLOGY
Improving E&P performance with right-time business intelligence
Right-time asset management requires near-real-time operations monitoring and visualization for rapid decision making and effective performance management.
Mike Brulé and Craig Hodges, Microsoft, Houston.
The traditional realm of Business Intelligence (BI) was, for many years, confined to the CFO’s office. Until recently, BI was a capability afforded only to E&P and other companies’ financial analysts or accountants. They were looking for more efficient methods to maximize return on capital and to cut costs. With the trend in many industries toward merging financial and operational data,1 more people than ever need to have access to BI tools.
Surveillance instrumentation, computing-power and processor technology advances2-at substantially lower cost-have exponentially increased the data volumes collected in oilfield operations, critically driving the need for visualization techniques. The resulting mountain of data overwhelms traditional analysis techniques and E&P professionals’ abilities to process data for effective decision making. More cost-effective BI with intuitive visualizations and collaboration capabilities can be the solution.
These trends drive the need for BI tools that are not only available to financial analysts, but also to engineers, geoscientists and operations. The vision of “ubiquitous BI” takes deep problem-solving capabilities from the hands of just a few to the hands of executives, engineers and field workers.3
This article explores today’s availability of more powerful, visual and people-centric BI platforms, representing the next wave of capabilities that bring new opportunities for optimized production, higher profits and safer operations in oil and gas. It covers the three primary “waves” of BI in the oil and gas industry-from early models through Service-Oriented Architecture (SOA)-based mash-ups, to newer, Web 2.0 technologies and beyond-to help illustrate data analysis evolution through initiatives such as the “oil field of the future.” In addition, the article explores BI system design considerations as E&P companies seek to deploy BI solutions today.
RIGHT-TIME E&P ASSET MANAGEMENT
Tim Passingham, who heads up BT’s oil and gas business, says that continuous production planning, monitoring and troubleshooting of upstream assets are critical to producing more with less. Right-time asset management requires near-real-time operations monitoring and visualization for rapid analysis and decision making to achieve effective asset performance management.
In addition to the influx of structured data, E&P professionals must be able to take into account unstructured information such as leasing agreements, operating statements and exploration contracts simultaneously, with many terabytes of numerical data. Engineers can analyze an asset’s performance, identify which wells are not producing according to plan, and also analyze cost burdens such as lifting costs or energy consumption. Information can come from multiple sources across many departments from anywhere around the globe. This information is traditionally captured in dozens of reports and can take days or even weeks to access and analyze-often after a problem has progressed to a critical state.
New and more widely available BI tools allow engineers to quickly view near-real-time information as Key Performance Indicators (KPIs). Information that multiple departments, often in multiple geographies, previously captured in dozens of reports that took days or weeks to access and analyze, can now be quickly viewed as KPIs in a matter of seconds or minutes. KPIs include revenue and profit per barrel, lifting costs and other business-health indicators, Table 1.
| TABLE 1. Some E&P financial and production KPI metrics (actual vs. plan) |
 |
|
With KPI dashboards and scorecards becoming more established as performance-management tools, the door is open for a new wave of technology with color-coded alerts and equipment animations, and a highly capable 24/7 collaborative environment. This technology, in addition to the KPI dashboards and scorecards, helps managers, engineers and operations personnel detect and analyze problems faster and better in a familiar and secure Windows environment that is common across roles, at a much lower cost than other solutions with similar capabilities.
According to Steve Fortune, information management director for the BP Gulf of Mexico Strategic Performance Unit, BP has seen its KPI dashboard evolve over time from being very custom to now using counter-report services and moving toward PerformancePoint software and the BI architecture. As BP has moved through these solution evolutions, Fortune has found that “it’s progressively that much easier to configure new KPIs connected to new systems after the business changes.” He and his team need the ability to figure things out fast and a way to “keep those scorecards and visualizations up to date far more quickly than we’ve ever been able to do before.”
One exceedingly intuitive visual cue is the performance “heat map.” Performance maps can enhance a person’s understanding of an operational situation more quickly than laboriously combing through numbers. The new generation of KPI scorecards, dashboards and performance maps that include advanced visual cueing and real-time collaboration, enable oil and gas operators to “see the needle in the haystack” and make quicker and better decisions that drive operational efficiency and improve the bottom line. Preemptive knowledge gained before operational problems occur also promotes safer oil and gas operations.4
Jim Crompton, Chevron’s manager for IT Architecture for its global upstream operations, recognizes the large volume of data in play and the need to go beyond the obvious metrics to the subtle patterns that future operations will demand. “Advances in visualization techniques will help to identify and highlight the real opportunities in the large volumes of available data. These new tools will help the interesting patterns stand out and get the attention of the operator and analyst, and point to the right problems and opportunities to address.”
The overall performance management approach is to monitor the financial health of the business from a P&L standpoint. It includes monitoring detailed revenue and cost KPIs and noting variance alerts where corporate or asset performance goals are not being met. The next step is to drill down into the operational and engineering data to determine problems’ root causes. This important capability in the oil and gas business, sometimes called “operational BI,” is not all that is required to create a business that amplifies the power of its people. Unified communications and collaboration, in multiple forms, are necessary every step of the way.4 The complete IT platform combines BI and collaboration to help give people the data they need to make sound decisions more quickly and easily.
BI IMPACT ON THE OIL FIELD OF THE FUTURE
The oil field of the future is a broad solution set that embodies far-ranging principles, empowering people with the ability for remote performance management and optimization, total producing asset awareness and visibility, right-time analysis and decision-making, and accurate and rapid operational execution.
“This requires technology that can bring experts and digital assets together in a familiar environment easily and as needed,” said BT’s Passingham. These solutions encompass real-time data acquisition,5 KPI and score-carding analytics in dashboards and portals, with advanced visualizations, modeling and predictive analytics, and an advanced collaborative environment. Each of the super-majors confirms Oil Field Of The Future (OFOTF) and its Real-Time Asset Management (RTAM) principles as a top priority.6 All have major enterprise initiatives under different monikers: “Field of the Future,” “SmartField,” “i-field,” “X-Field” and others.7 The oil and gas industry confirms the industry’s shared principles for OFOTF, which, first and foremost, depends on people.
THE THREE WAVES OF BUSINESS INTELLIGENCE
From an IT standpoint, OFOTF has helped drive three “waves” of BI software systems in E&P. The first wave of BI for OFOTF was based on the adoption of Service-Oriented Architecture (SOA), with data aggregated from several sources in a data warehouse. IT specialists delivered reports through Web services, typically to a parameterized report generator with Microsoft Excel export. The early 2000s saw the .NET development of such OFOTF “report-generation” portals. Color-coded reports identified where problems were, but gave few details and were quickly outdated, creating multiple versions of the truth.
“Wave 2” saw composite applications provided as portal-hosted “mash-ups” of multiple data streams shown in role- and context-based visualizations of oil and gas production data, which helped analyze problem root causes. For example, Fig. 1 shows a mash-up of a super-major’s asset GIS map. The BI and GIS systems behind this mash-up collect and display real-time data from multiple sources. They also pull interactive equipment schematics using custom Web parts for those responsible for troubleshooting problems or tracking hurricanes to ensure personnel safety. The result is a single, real-time version of the truth.
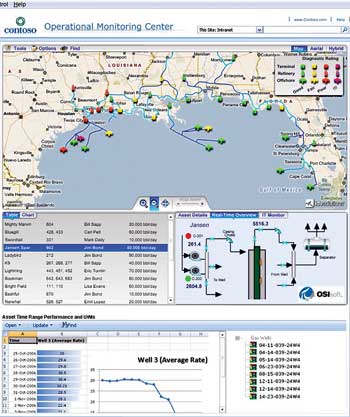 |
Fig. 1. “Wave 2” SOA portal-based composite applications with data provided from several sources via web services.
|
|
The composite-application mash-up approach of Wave 2 has several advantages. Development time is rapid because of loosely coupled integration with Web services. In some cases, IT professionals can develop a full application in short, three- to four-week iterations, starting with a visual spatial capability, and then adding role-based, context-relevant Web parts. Then they can deploy applications only one or two months later. Ten years ago, such applications may have taken more than a year to develop and would have cost 5-10 times more. E&P companies can now get out of the software business and assemble core business solutions more easily.
Chevron’s Crompton notes that today’s asset teams are prepared to respond to safety and environmental incidents and asset failures from performance dashboards and control-room environments. “But you need to do more to optimize field and reservoir performance. You need to become more predictive and go beyond catching alarms to recognize and prioritize the high-value opportunities.”
Now that the popular Wave 2 portal-hosted composite applications are widely used as a viable vehicle for delivering useful IT capabilities in E&P, what might we envision for Wave 3 that would be even more transformational for the E&P business? Certainly elements of Web 2.0-such as collaboration technologies, blogs, wikis and other tools-and beyond are part of that vision.
The third wave achieves two goals: agility and virtual teaming. Wave 3 builds on the Wave 2 composite applications to provide additional business-productivity infrastructure for visual BI and predictive analytics with unified communications and collaboration. People will have the ability to be more agile if equipped with the quick, intuitive visual cueing made possible by powerful BI and corporate performance management tools, enabled by real-time monitoring and alerting. This, combined with the ability to collaborate with audio and video over large geographical distances, reduces analysis time and enables more informed decisions.
BP’s Fortune believes that the visual aspect is a key way to analyze complex facilities and large quantities of data. Comprehensive data analysis is “automated through very nice, simple graph point spaces that flag users for you. And you can actually scroll down to the right information, and that’s absolutely key to how we do performance monitoring and how we will run our business in the future.”
BUILDING THE AGILE, WAVE 3 BI SYSTEM
After considering the tremendous productivity, production and ROI benefits, can an effective BI solution be created that has these Wave 3 capabilities? Given the complex challenges of managing numerous data sources and the time required to “cleanse” the data, one may think it is virtually impossible to get to this level of operational BI capability. Holistically, that may be true. However, that should not inhibit an asset team or business unit from beginning the journey and realizing these types of systems and the related benefits.
Business intelligence requires access to “trusted data that is consistent, accurate and complete, to be able to get value out of your BI investment, whether you’re just trying to report performance results or do something with more sophisticated analytical tools,” says Crompton.
Although the following is not intended to be a complete BI system-development how-to guide, it gives some high-level considerations and major steps using industry-standard methods.
Determine the business architecture. Consider the overall company goals, the processes that will be affected and how those processes will be enhanced and improved. Set specific goals, such as reducing decision time for oilfield operations from two weeks to two days. Gaining agreement on a set of business rules is critical. Conduct a facilitated session among the major stakeholders to gain understanding and agreement on conditions required for optimal performance.
Collect requirements. Start with the highest-priority production issues for the most significant oil fields and build a set of data requirements around those issues. Keep in mind that optimization is often achieved by advanced reservoir modeling and field optimization that also impacts the requirements as referenced by industry experts.8
Determine IT architecture. Consider security needs, mobility requirements, offline-operations broadband requirements and other aspects of the company IT infrastructure needed to deliver the BI tools and applications to users.
Design overall application architecture and integration environment. Many companies already have standardized methods for SOA applications delivery. The overall architecture provides the integration point to take data from many source systems and present a consistent and cleansed data set using visual front-end tools as a single version of the truth. The data can also be delivered via Web services. Many E&P companies are pursuing SOA delivered through composite-application portals such as Fig. 1. Others want to take advantage of coupling their operational monitoring portals to surrogate or proxy models that are supported by detailed reservoir modeling and simulation,9 to provide deeper decision-support capabilities in the BI system.
Master Data Management (MDM) and data modeling. Create a list of selected data types that will provide the most insight when analyzed together. Create a meaningful, normalized relational data model or business-process dimensional model10 that allows you to analyze as many subject areas as possible. The more subject areas that can be analyzed, the more operational problems can be solved.
Determine database typology. Creating the appropriate database architecture enables a single data model and source for monitoring, analyzing and planning. E&P companies can align their resources based on this single data model and trust the information they use across all business areas. Data volume and analytics workload are key considerations for centralizing or federating data.10
Comprehensive BI systems run the gamut from tactical (what is happening) to strategic decision making (what will happen and what should happen). They are typically built on a Business Activity Monitoring (BAM) and BI design pattern, which combine near-real-time production data monitoring with offline historical data analytics. Chevron SOBI (Service-Oriented BI)11 and proprietary OSIsoft RtPortal are examples of a Wave 2 design pattern for real-time operational BI. The appropriate mix of OnLine Analytic Processing (OLAP) methods is determined-i.e., Relational (ROLAP) vs. Multidimensional OLAP (MOLAP). Examples of these and other BI design patterns and detailed implementation approaches can be found in the literature.10,11
Implement data-cleansing and integration process to continually build the database. Perhaps the most important aspect of the system is data integration and a governance plan to determine how data will be cleansed and brought into the BI system. As shown in Table 1, the E&P business involves a variety of engineering, operations and management metrics, or KPIs. Over two dozen disparate data sources are eventually presented into role-based contextual cockpits, a visualization system and custom Web parts. Figure 2 shows that data has to be integrated from sources such as production accounting, real-time production historian, SCADA systems and numerous other sources. It is moved via an ETL (Extract/Transform/Load) process into the SQL Server database, Fig. 2. Data is then dimensionalized and moved to cubes in an OLAP engine for presentation to the engineer in a visual form that is familiar and easy to understand. Figure 2 shows the OLAP engine presenting data in Excel and PerformancePoint.
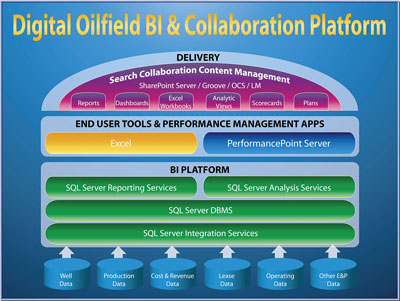 |
Fig. 2. “Oil field of the future” BI and collaboration platform.
|
|
Leverage BI visualization layer. A unique aspect of this portal-based composite-application approach is how easy it is to expand its use and continually roll out new applications based on different roles and business contexts. For example, the same development approach and toolsets can be used to rapidly and cost-effectively develop an oil and gas production-monitoring application or a health, safety and environment application.
Deployment and culture change. Train the asset team to use the tools and demonstrate their business value.
Using BI tools in the market today, advanced analysis and visualization applications can show financial or production-operations data that can be sliced and diced for drilldown. This can determine the root cause of declining profitability or increasing costs that impact the business. This role-based capability, once reserved for professionals in the finance group, can now be made available to a much broader set of operations personnel.
AN E&P BUSINESS SCENARIO
Perhaps the easiest way to understand the value of such a powerful set of tools is to show how it would apply in a realistic E&P scenario. Although these concepts, technologies and software products are not meant to replace sound reservoir- and production-engineering practice, the focus here is how an asset team’s processes can be enhanced through quicker analysis and more effective virtual teaming.
This scenario highlights corporate performance management with operational BI capabilities. It also shows how “scorecarding” and analytics can help engineers and field personnel identify the root cause of an oilfield problem. Once this occurs, a rich, real-time collaborative toolset combining email, interactive workspaces, virtual meeting places, instant messaging and voice-over IP can be used to discuss, solve and take action on the problem. An E&P company monitors its financials and production data in near-real-time to keep track of its business health. A geographically dispersed virtual asset team may include a regional vice president, production manager, field reservoir engineer and corporate planning analyst.
The example field represents a typical scenario: Crestal gas injection is used to maintain pressure and to maximize condensate production from a large reservoir. NGL yield is declining for a cluster of two dozen wells. Gas-oil ratio and watercut are also going up much faster than forecasted. Gas flowrates are escalating for several wells. Average bottomhole pressure is decreasing. The root cause: Sand is cutting out the chokes in several wells and making the gas rates uncontrollable, which causes pressure maintenance failure on the overall reservoir. The asset team is charged with uncovering this problem through near-real-time operations monitoring and BI performance management, and then communicating and collaborating in real time with its service company to do workovers on the affected wells and solve the problem.
How do the new visual BI tools accelerate finding and resolving operational problems? The scenario first unfolds when the virtual asset team receives an email showing a variance alert. One of the production managers notifies another team member noting declining revenue KPIs. They are aware that a major field’s goals are not being met and have already started investigating. A scorecard of total production volumes, daily production volumes, average price realized for oil and gas, and lifting costs ($ per boe) shows negative trends (against plan) for this large pressure-maintenance field. Production is decreasing unexpectedly, so the asset team drills down deeper into production-related KPIs and detailed data to determine which fields/reservoirs/wells are affected-and the root cause of the problem. As the production manager assures the vice president, the asset team is looking at the data to determine the problem.
A field is quickly identified with a red down arrow as having a problem, Fig. 3. Clicking on the field tab reveals the overall average production trends, NGLs decreasing, pressure decreasing and watercut and gas flowrate rising unexpectedly, not in accordance with the field’s production plan.
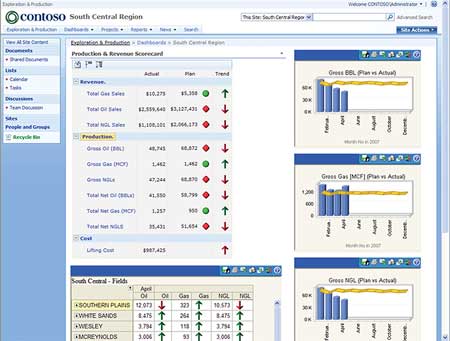 |
Fig. 3. A scorecard showing the variance of KPIs from the company plan. An intuitive green, yellow or red traffic-light metaphor instantly signals problems. A red down arrow means that a KPI is not meeting the plan.
|
|
The reservoir engineer slices and dices into the detailed numbers to explore the root cause. The engineer first looks at a “heat map” of oil produced vs. watercut by well, then oil produced vs. NGL yield. The size of the rectangle quickly indicates the wells with the largest production. The color of the rectangle indicates if the well has a problem (Fig. 4), e.g., if watercut is too high or if NGL yields are drifting downward. If the rectangle is green, then it is meeting the plan as determined by detailed reservoir modeling; if it is red, it is not meeting the plan. Business rules are set to automatically alert the engineer, saving at least half the cycle time when compared with poring over thousands of lines of a numerical table. Measures can quickly be plotted in graphs to discern other trends. A precipitous decline in bottomhole pressure is shown, which concerns the reservoir engineer.
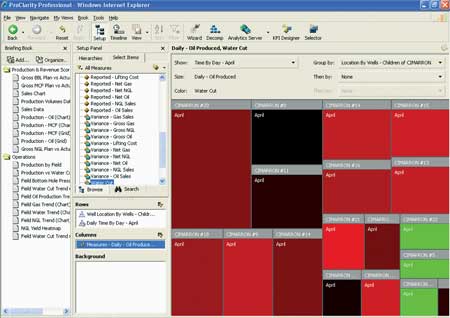 |
Fig. 4. Maps showing well performance condition by months for selected parameters, in this case, production vs. watercut. Tabular data for more than a 100 metrics and KPIs are a click away, but the visual cues instantly show the engineer the problem areas.
|
|
The reservoir engineer now checks the heat map and trend chart for NGL production. With a double-click, the engineer can drill into individual wells’ heat maps. The reservoir engineer agrees with the production foreman that several wells have sanded up, and they will need to get a service company involved to do some workovers.
This BI and collaboration environment is even more important as such situations become more complicated. Operational monitoring and BI analytics of both financial and engineering data, combined with real-time collaboration, provide transformational decision-support and performance management for the modern E&P global operator company. 
LITERATURE CITED
1 Eden, S., “Hyatt merges financial and operational data,” Information Week, January 17, 2006.
2 Ades, M. and M. Mikulis, “New capability in personal and high-performance computing provides choices,” World Oil, November 2006, p. 137.
3 Hoover, J. N., “Ubiquitous BI: If anybody can do it, maybe Microsoft can,” Information Week, May 14, 2007.
4 Wall Street Journal “Working together when apart: How to make virtual teams into winners,” June 16, 2007, p. R1.
5 Sood, S., “Use of real-time operations growing upstream,” Journal of Petroleum Technology, July 2007.
6 Magness, D., “Foundation for real-time asset management,” SPE 99777, April 2006.
7 Nordtvedt, J. E. and T. Unneland, “Implementing real-time asset management: A practical perspective,” SPE 99468, April 2006.
8 Stenhouse, B., “Learnings on sustainable model-based optimisation-The Valhall optimiser field trial,” SPE 99828, April 2006.
9 Cullick, S., “Assisted reservoir simulation matching enabled with global optimization and nonlinear proxy models,” SPE 92435.
10 Kimball Group, The Microsoft Data Warehouse Toolkit, Wiley, 2006.
11 Gordon et al., “Service-oriented business intelligence,” The Architecture Journal, Issue 6, 2006.
ADDITIONAL BIBLIOGRAPHY
Edwards, T. et al., “Advanced collaborative environments at BP,” 2006 Intelligent Energy Conference, SPE 100113, Amsterdam, The Netherlands, April 11-13, 2006.
Reddick, C., “Advanced field of the future: Making BP’s vision a reality,” 2006 Intelligent Energy Conference, SPE 99777, Amsterdam, the Netherlands, April 11-13, 2006.
|
THE AUTHORS
|
|
Mike Brulé is CTO, Oil & Gas, Microsoft. He spent the first half of his 31 years in the energy business with Kerr-McGee and Shell working in North Sea gas-condensate field development, and Gulf of Mexico enhanced oil recovery and deepwater field development. Mike also founded Technomation, an IT firm providing enterprise solutions to E&P majors, independents and oilfield service companies. He holds a PhD in chemical engineering and an MBA from the University of Oklahoma and is a licensed professional engineer.
|
|
|
Craig Hodges leads the sales, marketing, partner and solutions teams as Microsoft’s US Energy and Chemicals Solutions director. He is responsible for the development and execution of Microsoft’s industry strategy, solutions portfolio, go-to-market model and relationships with key industry solutions partners and customers. Hodges brings more than 27 years of executive leadership experience with the majority of that time focused on the global oil and gas industry.
|
|
|


