OUTLOOK 2005: United States
US Rotary Rigs
Better gets better still
Well, last year, the headline was “A good year should get even better.” So how do you follow that when things just keep looking up? No matter how you measure it, 2004 was a very good year in the oilpatch, and indications are that it was still going up at year-end. Nothing like a Middle East war combined with the inevitable reality that the developing world wants all the “stuff” that rich nations have, epitomized by China and its rising energy demand, and you have more than enough reasons to send prices higher – much higher.
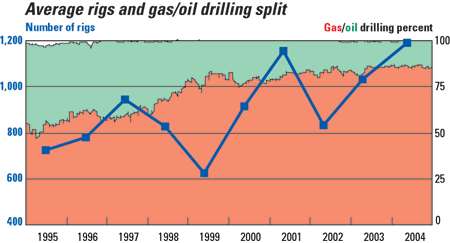
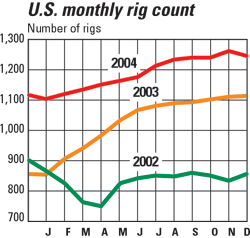
The year started with 1,106 rigs and finished with 1,243, giving an average of 1,190, which is a 15% increase for 2004. We had forecast 1,130 rigs, so we were off by 60. This year, if efficiencies stay about the same, or perhaps nudge up slightly, we forecast that 2005 will see 8% more rigs, to an average 1,285 rigs.
The October ReedHycalog rig census says that there are enough rigs to meet this scenario, although some categories of rigs could see upward pressure on dayrates, as utilization reaches 90%, perhaps higher. The gas/ oil-directed drilling split appears to have plateaued, as the ratio has stayed near 85-87% all year. 
These numbers, from Baker Hughes, represent only those rigs that are significant consumers of oilfield services and supplies. It does not include very small truck-mounted rigs or rigs that can operate without a permit. However, non-rotary rigs such as coiled tubing and workover rigs drilling new wells may be included. To be counted, a rig must be on location and be “actively” drilling. A rig is active from the moment the well is spudded until it reaches TD. Rigs that are in transit, rigging up, performing workovers, completions or production testing, are not counted.
 |
| |
Average number of US rotary rigs in operation1 |
|
| |
State or area |
2004
Avg. |
2003
Avg. |
% Diff. |
|
| |
|
|
| |
Alabama–Onshore |
2.2 |
1.6 |
37.5 |
|
| |
Alabama–Offshore |
0.4 |
0.8 |
–50.0 |
|
| |
Alaska–Onshore |
9.8 |
8.9 |
10.1 |
|
| |
Alaska–Offshore |
0.2 |
0.9 |
–77.8 |
|
| |
Arkansas |
6.3 |
2.1 |
200.0 |
|
| |
California–Onshore |
20.3 |
17.9 |
13.4 |
|
| |
California–Offshore |
3.4 |
3.2 |
6.2 |
|
| |
Colorado |
54.2 |
38.8 |
39.7 |
|
| |
Kansas |
6.7 |
8.7 |
–23.0 |
|
| |
Kentucky |
4.4 |
4.3 |
2.3 |
|
| |
Louisiana total |
167.0 |
157.0 |
6.4 |
|
| |
North |
39.3 |
28.5 |
37.9 |
|
| |
Inland water |
18.1 |
14.3 |
26.6 |
|
| |
South |
30.3 |
29.5 |
2.7 |
|
| |
Offshore |
79.1 |
84.6 |
–6.5 |
|
| |
Michigan |
3.0 |
3.0 |
0.0 |
|
| |
Mississippi |
9.8 |
8.1 |
21.0 |
|
| |
Montana |
19.8 |
14.0 |
41.4 |
|
| |
New Mexico |
67.1 |
64.7 |
3.7 |
|
| |
New York |
4.9 |
2.7 |
81.5 |
|
| |
North Dakota |
15.1 |
13.7 |
10.2 |
|
| |
Ohio |
6.7 |
7.4 |
–9.5 |
|
| |
Oklahoma |
159.0 |
128.0 |
24.2 |
|
| |
Pennsylvania |
9.0 |
10.1 |
–10.9 |
|
| |
Texas total |
506.0 |
449.0 |
12.7 |
|
| |
Texas offshore |
12.8 |
17.6 |
–27.3 |
|
| |
Inland water |
1.3 |
2.5 |
–48.0 |
|
| |
District 1 |
11.8 |
13.4 |
–11.9 |
|
| |
District 2 |
27.5 |
26.4 |
4.2 |
|
| |
District 3 |
57.5 |
48.1 |
19.5 |
|
| |
District 4 |
70.8 |
78.7 |
–10.0 |
|
| |
District 5 |
61.1 |
53.3 |
14.6 |
|
| |
District 6 |
70.1 |
54.0 |
29.8 |
|
| |
District 7B |
8.1 |
1.3 |
523.1 |
|
| |
District 7C |
37.3 |
27.1 |
37.6 |
|
| |
District 8 |
47.6 |
45.6 |
4.4 |
|
| |
District 8A |
14.7 |
15.4 |
–4.5 |
|
| |
District 9 |
37.5 |
39.5 |
–5.1 |
|
| |
District 10 |
47.5 |
26.1 |
82.0 |
|
| |
Utah |
21.5 |
13.5 |
59.3 |
|
| |
Virginia |
1.0 |
0.9 |
11.1 |
|
| |
West Virginia |
15.0 |
15.5 |
–3.2 |
|
| |
Wyoming |
73.6 |
53.7 |
37.1 |
|
| |
Others2 |
3.4 |
3.6 |
–5.6 |
|
| |
|
|
| |
Total US |
1,189.0 |
1,032.0 |
15.3 |
|
| |
Totals may not add due to rounding
1Source Baker Hughes
2Others includes Florida, Nevada, South Dakota and Tennessee |
|
|
|


