North American Gas
Taking the High Road
North American supply and demand are remarkably volatile, yet remain in a constant range despite record drilling. Meanwhile, traders keep gaming and playing the game with gas prices.
Leonard Parent , Contributing Editor, World Oil
Prices are up, drilling is up, well completions are up. These should be good times. But we’ve only just begun. The outlook in 2005 is for wellhead prices to average close to $6.25. Volatility is still with us, and at times even more so. The FERC is working on keeping the players in check, which isn’t easy when you’re talking big bucks.
Forecasts indicate no letup in exploration activity. The expected demand increase did not materialize last year, which is probably just as well, given the price response to indications of tight supply. Don’t expect much increase in demand this year.
A record level of storage this past season is good insurance against shortages later on, even though high withdrawal rates from time to time give speculators room to run and play. New pipeline capacity is needed to move more Rocky Mountain gas to growing markets. Financing issues tend to slow progress on major projects.
Security has not been a significant problem, but safety will always be an issue as infrastructure ages. The Middle East can be a learning experience for those charged with doing something. There’s a lot we don’t know that we need to know, and what to do about it.
PRICES: THE GAME
The NYMEX is the biggest game in town. Where else can one play in a game that can move 10% or more every day and much more than that from month to month? The monthly numbers shown in Fig. 1 describe a wave-like pattern that has no consistency with weather or virtually any physical condition. This was clearly demonstrated last October – the last day of November trading – when the players picked up a storage-withdrawal number that was out of the expected range and turned that day’s last-minute trading into a blowout.
 |
Fig. 1. Monthly average gas prices, NYMEX futures, next month delivery, 2003 – 2004.
|
|
In the market, prices move trade by trade, affected by weather reports, weekly storage numbers, and whatever rumors race across the Exchange floor. Volatility may be great for traders, but that doesn’t necessarily hold true for buyers and sellers. But over the long term, the price drivers are gas supply and deliverability. As it stands right now, gas supply is tight, making a case for higher prices. And deliverability isn’t holding up, since high-flowrate reservoirs are depleted faster than they are being replaced.
All things considered, between the highs and lows, we are forecasting 2005 prices to average about $6.25/MMBtu. Monthly numbers will probably range plus or minus a dollar during the course of the year.
E&P ISSUES
Rig Count. Well, 1,082 working rigs are certainly respectable; nevertheless, the rig count seems to have reached a plateau of sorts, and it’s hard to get operators to put another rig on the payroll. The main reason given by knowledgeable observers is that the quality of prospects just isn’t good enough, even though prices are high. The best news is that rig counts have been on a pretty steady climb and do not appear to be stuck on the price-swing track.
Certainly high prices provide a lot of encouragement to explore and drill, but leading-edge operators are listening to the voices that urge them to be cool a little while longer. What the voices don’t tell us is how long a “little while” is. The flip side to the issue is the awareness that we’re replacing reserves but not deliverability.
The outlook is for a modest increase, at best, in the rig count for the foreseeable future, Fig. 2. Let’s not forget how much better off the US is at the beginning of 2005 than just a couple of years ago. However, issues like prospects, and access to lands that are currently off limits, are going to have to be resolved before a lot more rigs can be in the field.
 |
Fig. 2. Historic gas well rig count. Blue is forecast.
|
|
Drilling. Early estimates suggest that gas well drilling set a record in 2004, some 23,000 wells. We may not move much past the current peak, at least for the time being, or at least until such time as there is a breakthrough on availability of good prospects to the drillbit. The implication that any price downturn will be followed by a comparable drilling downturn isn’t necessarily so.
Much of the action has been in connection with coalbed methane (CBM) reserves and Texas shale. The main attraction is that CBM wells are low-cost, low-risk operations. CBM wells can’t match the production rate of high-deliverability offshore wells, but if you put enough of them together, it is possible to build a pretty substantial flow rate, which helps. For some good news, in 2004, there was a dramatic increase in exploratory drilling, representing a significant improvement in gas resource development that should give a big lift to long-term supply.
The outlook for drilling in 2005 is for continuation of the upward trend, but with moderation over the next couple of years. The strong rig count, if it stays on the course we have projected, could result in another record year for gas wells drilled, Fig. 3.
 |
Fig. 3. Historic number of gas wells drilled. Blue is forecast.
|
|
Production. According to DOE, production is estimated to have held virtually flat in 2004.
Given the tightened security situation and new rules applicable to offshore activity, the outlook for higher levels of deepwater drilling is not very promising.
Reserves. Table 1 data, taken from the DOE Annual Report on Reserves, lists Lower-48 proved dry gas reserves to be 180.8 Tcf at year-end 2003 (Fig. 4), that’s up by about 1.3 Tcf from 2002, less than 1%. At the rate we are going, year-end 2004 reserves will likely be approximately 184 Tcf.
| |
TABLE 1. Lower-48 gas reserves at year-end 2003, in Tcf. |
|
| |
Area |
Reserves |
Year/Year
change |
Production |
R/P
ratio |
|
| |
|
|
| |
Gulf of Mexico |
22.1 |
–2.6 |
4.3 |
5.1 |
|
| |
Texas – East |
27.5 |
0.3 |
3.5 |
7.9 |
|
| |
Texas – West |
18.2 |
1.1 |
1.7 |
10.7 |
|
| |
Wyoming |
21.7 |
1.2 |
1.5 |
14.5 |
|
| |
New Mexico |
17.0 |
–0.3 |
1.4 |
12.1 |
|
| |
Oklahoma |
15.4 |
0.5 |
1.6 |
9.6 |
|
| |
Louisiana |
9.3 |
0.3 |
1.3 |
7.2 |
|
| |
All Other (16 states) |
49.6 |
1.8 |
3.6 |
13.8 |
|
| |
|
|
| |
Total |
180.8 |
2.3 |
9.6 |
|
|
| |
Source: EIA |
|
|
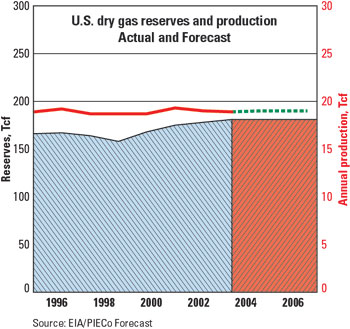 |
Fig. 4. Historic US dry gas reserves and production, plus forecasts.
|
|
The Gulf of Mexico and East Texas are the most prolific sources of US supply. It is estimated that they accounted for more than 40% of 2004 US production from only 27% of its reserves. That is not a good sign. Further, Gulf of Mexico reserves are declining at a fairly significant rate, Table 1. Reserve additions in the GOM offshore have not kept pace with production from existing reserves – down by 2.6 Tcf after production. The number is bad enough, but the direction is worse. This is an issue of great concern. The high-deliverability gas prone areas are needed to maintain flowrates to Eastern markets. These are mainly the Gulf of Mexico and East Texas, both of which lost ground. It’s nice to have more producing wells, but it is deliverability at the wellhead that puts gas in the pipelines.
Wyoming, which is heavily into CBM development, was the biggest reserves gainer, at 1.2 Tcf. West Texas is next at 1.1 Tcf. Louisiana reserve additions are low, recorded at 0.3 Tcf. This is not good news for those markets that depend heavily on gas from the Gulf Coast. The All Other category (16 states, including Colorado, up 1.5 Tcf) added 1.8 Tcf of reserves.
The deliverability issue is reflected by the R/P ratios shown in Table 1. The Gulf of Mexico R/P is an indication of high deliverability and, at the same time, of the need to maintain adequate reserve development to sustain high deliverability. The current downward trend in offshore drilling will have to be turned around soon.
Alaska, here we come. The substantial North Slope reserves, about 16 Tcf, dropped off the radar screens years ago due to the conventional wisdom’s projections that costs of building pipeline(s) from the North Slope to the Lower 48 were out of sight. This author worked on an Alaskan proposal years ago, which concluded that, even if suppliers gave the gas to the pipeline company for free, the cost of building the pipeline was too much.
That was then, this is now. The economics still haven’t improved all that much, but we’re getting closer to reality – call it governmental subsidy for lack of a better term. With a little luck and appropriate Congressional action, gas could actually be flowing by 2010. When and if it finally happens, we’re looking at 4 – 6 Bcfd coming to the Lower 48 from the North Slope and the Mackenzie Delta. That is equivalent to about 6 – 8% of current US average daily demand and 15 – 20 Tcf of high deliverability to the US reserve base.
Coalbed methane. Over the past 10 years, CBM reserves and production have about doubled, and now account for about 10% of proved reserves and 8% of dry gas production, Table 2. The majority of CBM reserves are in Rocky Mountain states, apart from about 7% in the Black Warrior basin of Alabama. Until recently, the rate of CBM reserve additions has averaged better than 5% per year, quite a bit greater rate than for reserves from conventional resources. However, this rate slacked off considerably in 2003, probably an indication of things to come. The EIA data suggest that CBM production has more or less stabilized, until such time as additional pipeline take-away capacity is put in place, to lift production above the current rate of about 8% of reserves, which will not be soon.
| |
TABLE 2. Coalbed methane reserves
and production, in Bcf. |
|
| |
Year |
Reserves |
Production |
|
| |
|
|
| |
1990 |
5,087 |
196 |
|
| |
1995 |
10,499 |
956 |
|
| |
2000 |
15,708 |
1,379 |
|
| |
2003 |
18,743 |
1,600 |
|
| |
2005E |
19,000 |
1,600 |
|
| |
Source: EIA |
|
|
The dark cloud in this picture is the environmental impact of produced water, which usually contains substances that are not suitable for human or livestock consumption, or agricultural use.
LNG
LNG has become the industry darling as more and more project announcements make the headlines, but it will take considerable time for the projects to get to the point of delivering gas into the system. When they do, they will come on strong. Starting in about 2007, look for LNG deliveries to ramp up to about 9 Bcfd by 2010, helping to keep the gas supply mix from cratering before the Alaskan pipeline comes online. However, expect that, because of tightened coastal security concerns and the usual “NIMBY” attitudes, there may well be delays in getting arrangements made.
A sometimes forgotten fact that’s worth remembering is Japan’s LNG imports, which just keep rolling along at about 60-plus Bcf per year. Not much change is expected there.
DEMAND
Well, a recovering economy didn’t happen in 2004, but we have high hopes for next year. Sound familiar? If the US economy finally gets rolling, we could get to a demand level of about 23.5 Tcf, like we did in ’02. It’s hard to forget that we are consuming about the same amount of gas today as we were 30 years ago during the oil crisis of the ’70s.
Two things are at work here, high prices and demand destruction. Demand destruction is alive and well, and it mostly comes about as a result of high prices. Picture this: A company that consumes natural gas in its manufacturing processes can build a plant in another country – where gas is considerably less expensive – and produce and ship the product to the door of its US plant, cheaper than that plant can produce the product locally (and perhaps with a tax incentive as well). Such is life. A lot of the expected gain in 2005 is, once again, dependent on a long-awaited robust economic recovery.
The 30-Tcf market that was to have happened by 2015 has vanished into the mists of time. A long-term reality check is in order. Earlier pronouncements that held that gas demand will pass the 30 Tcf mark by 2020 are now 50/50 at best, and that’s if we find the gas to put in the pipelines. It would take a combination of many positive factors to make it: LNG, together with gas from Canada and Alaska, as well as steady US production.
Spending money in these trying times for power plant upgrades is a luxury not many can afford. One fallback position is to rethink the option of refurbishing old plants. Another is to step up the construction of distributed-generation projects, spreading the capital outlay amongst a broader group of investors. There could easily be fewer of the relatively high-efficiency Combined Cycle Gas Turbine generating stations coming online over the next few years than previously expected.
The issue cuts both ways in terms of gas consumption, refurbishing old gas-using facilities makes for an improvement in consumption efficiency, less gas consumed and better utilization. Refurbishing old coal-fired steam plants or extending the life of nuclear plants means a loss of market for gas, period. Players caught in a capital squeeze will do whatever they have to. The Presidential Administration initiatives are relaxing environmental regulations and, in the process, encouraging operators to hold off new gas-fired capacity, which in turn could lead to a shrinking of the near-term prospects for electric generation gas consumption.
STORAGE
Last year was a banner for storage, which made it to a new peak. Absent record level withdrawals in the first quarter, we can expect that gas in storage will more than likely be sufficient to meet demand. Over the long haul, storage development continues, adding capacity and deliverability, downgrading deliverability issues.
PIPELINES
There’s not much going on in the way of capacity additions. Debottlenecking is with us as markets change, and, as new demand is created, such as with, new gas-fired electric generation, there is a need for financing. Given the capital crunch and environmental restrictions, we can expect that major projects will be deferred as long as possible.
According to the Natural Gas Supply Association, GOM reserves are being depleted at rates sometimes approaching 50% during the first year online. The cost of building short-lived pipelines and deepwater gathering facilities to deliver gas to the existing pipeline market, and still make profit, puts pipeline operators in a difficult place. This observation is borne out by noting that the number of rigs drilling in the Gulf of Mexico is flat to down.
SECURITY
Security is a work in progress, and is not likely to change in the present environment. Additions and revisions to the gas industry infrastructure impact the industry’s risk profile. It is not something that operators are willing to talk about. The players can spend money until the well runs dry and all the while not have done much for their comfort zone. Solutions can turn on capacity additions, innovative repair and recovery systems. Many years ago, during the cold war, a lot of effort went into developing pipeline interconnects all over the country to cope with the possibility of disruptions. As it turns out, under the umbrella of deregulation, many of these interconnects have enabled the players to move gas across the interstate network with remarkable ease, lessening absolute exposure to disruption. In the process, we’ve learned how to make transportation alternatives work. Nevertheless, the exposure is there, win, lose or draw.
IMPORTS/EXPORTS
Imports from the Western Canada Sedimentary basin and from Nova Scotia are not living up to expectations. But better times are ahead as Canadian companies get into CBM development. All told, exports to the US account for about two-thirds of annual Canadian production.
On the flip side, exports from the US to Canada are up and are likely to grow, representing utilization of US pipeline capacity to deliver gas from Western Canada into Eastern Canada markets, to a point where gas from offshore eastern Canada is competitive.
Exports to Mexico are on the rise, up about 20% in 2004 alone, continuing the trend started just a few years ago. Electric generation in northern Mexico is the primary reason for the increase. Imports from Mexico dwindled to zero in 2002 and have shown no signs of restarting any time soon.
CANADA
According to the Canadian Gas Potential Committee (CGPC), the Western Canada Sedimentary basin (WCSB) continues as the location of the majority of conventional gas supply in Canada, estimated to be about 142 Tcf. All told, including Nova Scotia and the Northwest Territory, Canada’s nominal remaining marketable gas reserves are about 190 Tcf. Going a step further to include reserves in remote frontier areas, the total rises to about 233 Tcf. Going another step further, the volume of unconventional gas resources in place is estimated to be quite substantial. However, development of these resources will require considerable capital expenditures and drilling programs, something not likely to occur in the foreseeable future absent significant technological breakthroughs.
MEXICO
It isn’t that Mexico is short on resources. To the contrary, Mexico is relatively rich in established gas reserves. Most are located in the Burgos basin in northeast Mexico, within reach of US pipelines and markets. However, the country has to firmly decide on its energy development policies before much of anything can happen. A “down the road” item.
SUMMARY
According to the EIA’s Energy Outlook, there are 6,000 Tcf of gas reserves worldwide, of which the US is the sixth largest with its 180-plus Tcf, about 3.1%. The conventional wisdom holds that gas demand will grow and that deliverability to meet that demand from domestic reserves will be the key. But it’s going to take more than domestic production to satisfy expected demand in the years to come. Imports from Canada and gas from Alaska will be needed to cope with demand growth. LNG projects will be a vital supplement to US gas supply. It’s nice to add reserves, as has been the case, but it’s even nicer to add deliverability and reduce price volatility. What it boils down to is a recognition that US resources and technology need to be put to use in a timely manner. Dancing at the brink may be exciting, but the consequences of a fall can be catastrophic.
Natural gas is a likeable fuel, but if the price gets out of hand, users will find ways to get along without it. Accordingly, this projection accepts the premise of higher prices in the months and years ahead.
Despite record numbers of gas well completions, US gas supply is not out of trouble and likely never will be. The country is still gaming around with price volatility, providing fun and games for the gamblers on the trading floor of NYMEX. There are other ways to make deals.
The country must get on with drilling even more gas wells, and soon. It must scale up exploration expertise, building on technological gains and coming up with more. Reserve additions will have to more than simply keep up with production, to better cushion against speculative volatility. The US must be assured that its resources are as secure and safe as can be, from wellhead to LNG receiving terminals, and convince the next generation to explore in the best tradition of the wildcatters that got this thing going in the first place. Piece of cake. 
THE AUTHOR
|
 |
Leonard V. Parent, a World Oil contributing editor, holds a BS degree in chemical engineering from Purdue University, and has been active in the gas business since 1950, beginning with Natural Gas Pipeline Co. of America. He later joined Trunkline Gas Co. in Houston and, in 1968, was appointed to corporate planning for Panhandle Eastern. Mr. Parent took early retirement after 26 years with Panhandle and Trunkline, and embarked on a second career as a consultant and publisher of The Gas Price Report and The Gas Price Index.
|
| |
|
|

