OUTLOOK 2004: United States
US Production
Production remarkably flat – again
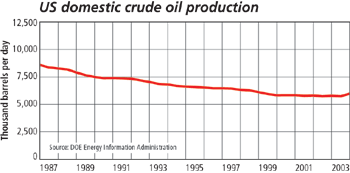
Crude. Preliminary data indicates that US crude production was flat in 2003, registering a slight one-half percent gain. Judging from some still-raw fourth quarter data, it is possible that, after revisions, the 2002–2003 change could be even up to 1% – perhaps greater. What's noteworthy about this is that US production is normally on a steeper downward trend, but recent years have been barely negative. This flattening is good news, considering how US crude and condensate production has fallen in previous years (see chart).
Alaskan oil production added another year to 2002's momentary hiatus in decline, gaining a very benign 0.1%. Future years are like to see the decline gradually return, absent some sort of miraculous discovery. Excluding Alaska, the Lower 48 States had a very small production increase.
It remains unclear whether Alaska's ANWR will help fill the Trans Alaska Pipeline. Republicans had a chance to unilaterally open the area as a budgetary item, but defection among their ranks killed that idea, while Democrats seem determined to play the wildlife refuge angle to voters, as if oil was unimportant to the US. Thus, the region seems more valuable as a political football than for its resources, whether oil or wildlife. Other aspects in the Energy Bill – indeed, the bill itself – seem equally nebulous for passage.
Petroleum demand in 2003 grew an estimated 1.4% to about 20 million bopd, partly on the strength of oil substitution for gas in electric power generation and some industrial uses. In 2004, demand is expected to climb 1.9%.
Natural gas. Gas demand is estimated to have declined 2.6% in 2003, apparently due to high prices curbing demand. The EIA, as in previous years, expects 2004 demand to be up by about 1.2%. Early estimates point to a 2.0% increase in gas production in 2003. Gas production is expected to continue a modest expansion through 2005, as gas well completions, which totaled an estimated 20,000 in 2003, grow to between 21,000 and 22,000 wells per year over 2004 – 2005. 
| |
US crude and condensate production by state (thousand barrels) |
|
| |
|
Barrels daily |
Barrels annually |
|
|
| |
State |
2003* |
2002** |
2003* |
2002** |
% Diff. |
|
|
|
|
| |
Alabama |
21.9 |
23.6 |
7,999 |
8,631 |
–7.3 |
|
| |
Alaska1 |
985.5 |
984.5 |
359,708 |
359,335 |
0.1 |
|
| |
Arizona |
0.1 |
0.2 |
27 |
63 |
… |
|
| |
Arkansas |
20.2 |
20.1 |
7,362 |
7,344 |
0.2 |
|
| |
California2 |
765.5 |
788.5 |
279,408 |
287,793 |
–2.9 |
|
| |
Colorado |
40.2 |
48.6 |
14,685 |
17,734 |
–17.2 |
|
| |
Florida |
8.4 |
10.0 |
3,073 |
3,656 |
–15.9 |
|
| |
Illinois |
32.1 |
33.0 |
11,716 |
12,051 |
–2.8 |
|
| |
Indiana |
5 |
5.4 |
1,825 |
1,962 |
–7.0 |
|
| |
Kansas |
90.6 |
89.6 |
33,065 |
32,721 |
1.1 |
|
| |
Kentucky |
8.8 |
7.3 |
3,226 |
2,679 |
20.4 |
|
| |
Louisiana2 |
1,575.90 |
1500.6 |
575,204 |
547,729 |
5.0 |
|
| |
Michigan |
16 |
19.8 |
5,838 |
7,219 |
–19.1 |
|
| |
Mississippi |
45.7 |
49.4 |
16,671 |
18,015 |
–7.5 |
|
| |
Missouri |
0.1 |
0.3 |
43 |
95 |
… |
|
| |
Montana |
49.5 |
46.2 |
18,070 |
16,855 |
7.2 |
|
| |
Nebraska |
7.9 |
7.6 |
2,889 |
2,779 |
4.0 |
|
| |
Nevada |
1.4 |
1.5 |
527 |
553 |
–4.6 |
|
| |
New Mexico |
178.2 |
183.7 |
65,043 |
67,041 |
–3.0 |
|
| |
New York |
0.5 |
0.5 |
164 |
165 |
–0.4 |
|
| |
North Dakota |
81.5 |
84.9 |
29,748 |
30,993 |
–4.0 |
|
| |
Ohio |
16.2 |
16.4 |
5,905 |
6,004 |
–1.6 |
|
| |
Oklahoma |
177.7 |
182.6 |
64,871 |
66,642 |
–2.7 |
|
| |
Pennsylvania |
5.9 |
6.1 |
2,159 |
2,233 |
–3.3 |
|
| |
South Dakota |
2.9 |
3.3 |
1,077 |
1,214 |
–11.3 |
|
| |
Tennessee |
0.8 |
0.8 |
292 |
275 |
6.2 |
|
| |
Texas2 |
1,455.20 |
1439.8 |
531,148 |
525,547 |
1.1 |
|
| |
Utah |
34.2 |
37.5 |
12,496 |
13,676 |
–8.6 |
|
| |
Virginia |
0 |
0.1 |
6 |
22 |
… |
|
| |
West Virginia |
3.5 |
3.8 |
1,291 |
1,382 |
–6.6 |
|
| |
Wyoming |
145.3 |
149.9 |
53,035 |
54,717 |
–3.1 |
|
|
|
|
| |
US Total |
5,776.70 |
5745.6 |
2,108,571 |
2,097,125 |
0.5% |
|
| |
Lower 48 |
4,791.20 |
4761.1 |
1,748,863 |
1,737,790 |
0.6% |
|
| |
|
|
|
|
|
|
|
| |
*Estimated using API and DOE data
**Revised using DOE data
Totals may not add due to rounding |
1Includes state waters
2Includes state and federal waters |
|
|
|