United States: U.S. rotary rigs
U.S. ROTARY RIGSOptimism goes south at year-end
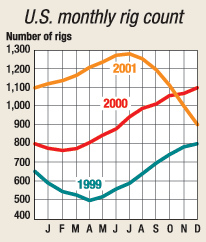
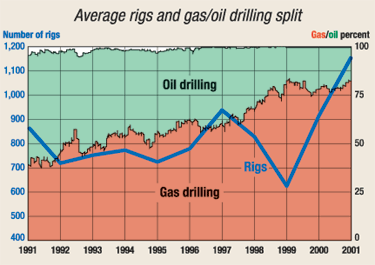
Last year began with the U.S. rig count surpassing the 1,000 benchmark, reaching 1,118. Thereafter, the count rose steadily to 1,270 in June. However, as the U.S. recession began impacting oil and gas prices, a decline became apparent in August. Then, as the aftereffects of the events of September 11 took hold in the form of $18 oil, the number of rigs operating plummeted to only 901 in December. Despite the drop, the average number of rotary rigs operating during 2001 was still 26% higher than the prior year. Drilling (in terms of rig count) rose in every area, except Arkansas, Michigan and Nebraska, and Texas’ inland waters. The largest increases during 2001 were recorded in several Texas Railroad Commission districts, including an impressive 87.7% jump in District 9 and an 84.7% rise in District 7C. In California, where high gas prices were actually a detriment early in the year (because of costs associated with burning fuel to produce steam for injection) the rig count took off in the spring as operators moved to take advantage of strong oil prices. The result was a 55.8% rise in rigs running for 2001. Not surprisingly, high gas prices as 2001 began precipitated a change in the mix of objectives targeted. According to Baker Hughes, about 84% of all U.S. rigs were drilling for gas at year-end 2001, compared to 79% in 2000.
World Oil’s forecast for U.S. drilling this year is for 30,249 wells, a decrease of 8%. The average rig counts expected to drill this number of wells is 1,030, or 11% fewer than last year. Due to current gas and oil prices, operators are expected to concentrate on less-expensive, lower-risk drilling, which will lead to improved rig efficiency, or more wells drilled per rig.
|
|||||||||||||||||||||||||||||||||||||||||||||||||||||||||||||||||||||||||||||||||||||||||||||||||||||||||||||||||||||||||||||||||||||||||||||||||||||||||||||||||||||||||||||||||||||||||||||||||||||||||||||||||||||||||||||||||||||||||||||||||||||||||||||||||||||||||||||||||||||||||||||||||||||||||||||||||||||||||||||||||||||||||||||||||||||||||||||||||||||||||
- Prices and governmental policies combine to stymie Canadian upstream growth (February 2024)
- U.S. producing gas wells increase despite low prices (February 2024)
- U.S. drilling: More of the same expected (February 2024)
- U.S. oil and natural gas production hits record highs (February 2024)
- U.S. upstream muddles along, with an eye toward 2024 (September 2023)
- Canada's upstream soldiers on despite governmental interference (September 2023)
- Applying ultra-deep LWD resistivity technology successfully in a SAGD operation (May 2019)
- Adoption of wireless intelligent completions advances (May 2019)
- Majors double down as takeaway crunch eases (April 2019)
- What’s new in well logging and formation evaluation (April 2019)
- Qualification of a 20,000-psi subsea BOP: A collaborative approach (February 2019)
- ConocoPhillips’ Greg Leveille sees rapid trajectory of technical advancement continuing (February 2019)


