Development of 4-D reservoir management West of Shetland
EXPLORATION / EXPLOITATIONDevelopment of 4-D reservoir management West of ShetlandBy embracing 4-D seismic as it emerged from an experiment to a reservoir management tool, BP’s commitment of faith and money has paid offRonald S. Parr and Marcus Marsh, BP, Aberdeen, UK
A significant reservoir seismic response has been observed and compared with field production history and reservoir-model results. It is qualitatively interpreted in terms of pressure and saturation. This data is paramount in helping the integrated subsurface team understand well performance and target infill wells. This year, BP and its field partners will be embarking on another chapter of this story, as the fourth, full-field 3-D/4-D is acquired since field discovery in 1992. This survey has been justified by the impact it will bring to optimizing the location of a small number of high-cost, deepwater wells. In future years, it is expected that this type of reservoir management will be extended across many more BP fields in the UKCS. This article describes the experience gained in 4-D imaging and time-lapse reservoir management on Schiehallion field. In addition, it presents four examples of interpreted reservoir changes. 4-D Seismic Method Conventional 3-D seismic surveys have been widely used to provide detailed subsurface information. They have been proven cost-effective, particularly in marine environments, for defining exploration prospects and fields. 4-D seismic provides images of dynamic changes in the reservoir which are analogous to those from time-lapse photography. These permit the subsurface team to interpret fluid saturation and pressure changes. Used in conjunction with a simulator that is well matched to all available surveillance data, 4-D has improved understanding of reservoir dynamics and, thereby, performance of existing wells. As a result, uncertainty in determining potential infill targets has been reduced. In West of Shetland, the economics of repeated acquisition are favorable – a typical, large marine 4-D survey may cost $2 to $3 million, while a single deepwater development well typically costs $20 to $30 million. This is not a new concept, having been tried in several diverse oilfield provinces over the years, but few case studies have demonstrated a commercial impact in a large field setting. Limiting factors include:
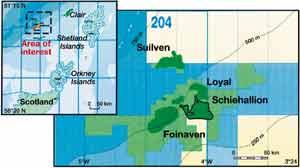
Time-lapse seismic has developed in West of Shetland beyond a geophysical research tool into a fully integrated part of dynamic reservoir management. NE Atlantic Developments BP’s West of Shetland developments, Foinaven and Schiehallion-Loyal, are situated 105 mi from the Scottish mainland in 1,000- to 1,600-ft waters. They were discovered in 1992 – 1993 on a "direct hydrocarbon indicator." Appraisal and development relied heavily on the pronounced seismic AVO and amplitude anomalies. Strong emphasis was placed on fluid imaging and net oil-sand prediction, relying on a good well database, careful seismic processing, and multiple 3-D volumes.1,2,3,4 The first 3-D survey was acquired in 1993 and confirmed the distinction between the high-amplitude, oil-sand response and nearly invisible water-wet sands. Localized, primary gas caps were subsequently found to have the highest amplitudes. Paleocene turbidite-reservoir sands at Schiehallion lie at a depth of 5,900 to 6,700 ft (»1,800 to 2,000 ms TWT). Horizontal wells need to be steered through the four, 30- to 160-ft-thick sand bodies to ensure that 1,000 to 3,300 ft of net rock is contacted, thereby allowing high-rate production.5 Field developments were sanctioned following two Extended Well Tests (EWTs), which demonstrated that good and sustainable production rates (>18,000 bopd) could be obtained from a large, connected volume. The fields achieved first oil in 1997 (Foinaven) and 1998 (Schiehallion-Loyal). Schiehallion oil is currently produced from 29 production and injection wells across five subsea-drilling centers. Reservoir pressure is close to bubble point. Near-vertical water injectors are employed to provide sweep and maintain pressure to avoid excessive gas breakout. Effective pressure maintenance relies on the presence of good hydraulic connectivity existing between injectors and producers. The variety of sediments in the turbidite package gives rise to a wide range of producer-injector communication. In Schiehallion, flow barriers are often subtle, and connectivity cannot be guaranteed from a static 3-D seismic image or an EWT. Poor connectivity could rapidly result in poor well performance and high gas levels produced from solution. Schiehallion currently produces about 160,000 bpd; while the total from both fields is about 260,000 bpd, or 8% of total UKCS oil production. Crude is stored in an FPSO and transported by shuttle tanker to an oil terminal on the Shetland Islands. 4-D Reservoir Monitoring The critical technical and business elements required for successful 4-D surveys are:
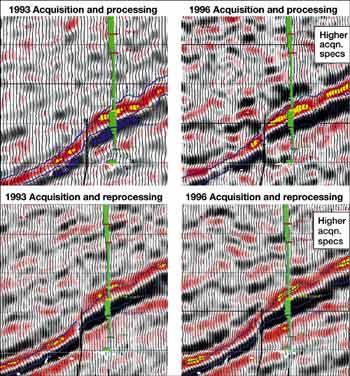
Capital return from 4-D acquisition can be easily justified when it will impact a new well, sidetrack or intervention. The impact of 4-D on reservoir-model history matching, rebuilding / reserves calculation and offtake management adds considerable value. Seismic repeatability. Schiehallion was imaged by two, conventional marine surveys before first oil: a 1993 dual-source, low-fold "exploration" 3-D; and a 1996, single-source, high-fold "development" 3-D. Both of these – and subsequent partial and full 4-D surveys – were acquired by PGS using different vessels and source / streamer configurations, but maintaining a common acquisition direction. Different contractors, using state-of-the-art sequence at the time, carried out initial processing of the 1993 and 1996 surveys. The 1996 survey generated improvements in frequency bandwidth, signal-to-noise ratio and reservoir imaging. It was successfully used to target most of the development wells, Fig. 2 (top).
In 1998, a pre-4-D study evaluated repeatability of the marine-seismic method. Part of the 1993 and 1996 data volumes – from shot gathers through fully migrated volumes – were reprocessed using an identical sequence. Fig. 2 (bottom) demonstrates that reprocessed versions have small differences in multiple content and bandwidth. Even more important is that, in both cases, they provided a more-accurate reservoir image than earlier processing had shown and a high degree of consistency between the two surveys at the reservoir level. RMS amplitude maps indicated that the average difference was 6% globally and up to 20% locally. These appeared to be randomly distributed and not correlateable to reservoir architecture. When mapped, the top and base reservoir picks were found to be very similar (ca. ±2 ms) over the two processed surveys. Predicted 4-D response; 4-D pilot. Conventional predictions for the 4-D-response magnitude involve taking log data and computing the seismic-impedance change for typical fluid-substituted cases: water wet, virgin oil, gas saturated, and depleted oil. On Schiehallion, these suggested that:
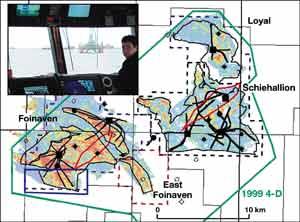
These findings implied that the predicted signal should be greater than the noise level. In 1994, 4-D was an emerging technology, and a pilot project was initiated in the West of Shetland area. The FARM (Foinaven Active Reservoir Management) project was designed to test the magnitude of the 4-D response and relative merits of surface- and seabed-seismic acquisition systems.6,7,8 In the summer of 1995, two pre-production, baseline 3-D surveys were acquired across a small part of Foinaven, the first using conventional-streamer technology, the second recorded through five hydrophone cables deployed on the seabed. In 1998, the FARM trial acquired a repeat 4-D survey over part of Foinaven.7 The results showed an increase in amplitude across the producing area. This was attributed to gas breakout from several wells that had been producing for ten months without water-injection pressure support. This trial confirmed that an observable 4-D seismic response could be detected for reservoir rocks in this area. Consistent acquisition / processing. Acquisition parameters for the 4-D surveys were defined from the two, full pre-production surveys (1993 and 1996). The reprocessing exercise indicated that low-fold, dual-source acquisition would give adequate results. The first genuine 4-D survey was acquired across Schiehallion in August 1999. Safe access for the seismic vessels to the fields is an important issue, especially with the presence of up to ten other vessels operating in the area. A single swathe area around the Schiehallion FPSO / drill rig could not be safely acquired, and there was no attempt to undershoot, Fig. 3.
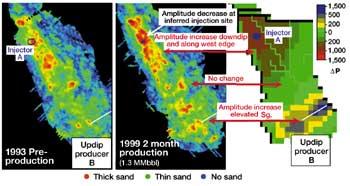
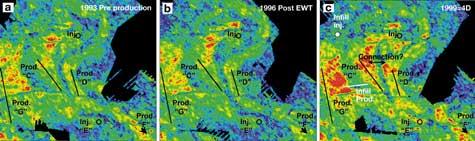
The priority processing area across Schiehallion was carried out by PGS using the same sequence as adopted in the initial 1998, pre-4-D study. No attempt was made to fine tune or match parameters so that the data could be pre-processed offshore, and the final, fully migrated volume was delivered seven weeks after the last shot. Acquisition of the 2000 survey was started in July and results are expected at the end of August. 4-D interpretation examples. A consistent 4-D interpretation emerges if the resulting amplitude and TWT maps are considered in conjunction with the history-matched reservoir model. This is based on production-injection performance and bottomhole flowing pressure data. Four examples are described below: Recent production / injection. Fig. 4 shows a top-sand amplitude map taken from the 1993 and 1999 3-D surveys and the predicted pressure-change map from a reservoir model at the time of the 4-D survey. The pre-production amplitude map roughly shows net oil-sand distribution in clearly defined channel sand.
Water was injected into the northern Well A into an oil column, and horizontal production commenced from Well B, in the updip part of the stacked channel-sand complex, two months before the survey acquisition. Seismic amplitudes have increased regionally away from injection point A, and their extent appears to match closely with the predicted pressure increase from the reservoir model. To the north of Well A, there is a local drop in amplitude that is consistent with the predicted extent of increased water saturation. Either drilling survey positioning or seismic imaging errors may explain the inconsistency between location of the amplitude drop and well injection site. Midway between the producer and injector is an area of little appreciable change in the seismic data, which is consistent with the pressure-change map. Therefore, in this example, the 4-D does not resolve the connectivity issue between the matched producer and its injector. Further to the south, there is again a region of elevated amplitudes away from producing Well B. This response is interpreted as indicating elevated gas saturation due to pressure reduction around the producer, as in the FARM example described earlier. Poor initial production / injection performance. Fig. 5 shows another example from east of Schiehallion. The pre-production surveys (a and b) show a high degree of similarity, but the 1999 4-D survey shows large changes around producers and injectors.
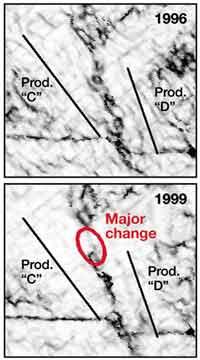
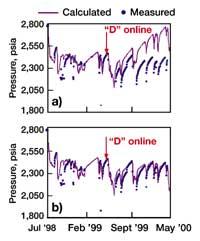
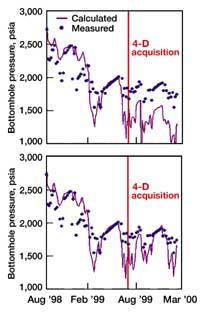
It was recognized from poor production rates and low bottomhole-flowing pressures that Well C was likely to be in a compartment poorly connected to injection support. Its extent is clearly picked out on the 4-D image by amplitude increase, interpreted as gas liberated from solution. This area is consistent with predictions from material-balance calculations. An infill injector will be drilled in late 2000 to alleviate the current pressure-support deficiency, Fig. 5c. The 1999 survey suggests the possibility of a connection (marked by an arrow) between producers C and D. It is most clearly shown on the coherency display, Fig. 6. The existence of such a connection had been suspected from material-balance analysis. A pressure match – assuming that producer C is isolated – fails after a time, Fig. 7a. The time of failure was about that at which producer D came on production. By assuming limited connection between the two, a good match could be obtained, Fig. 7b.
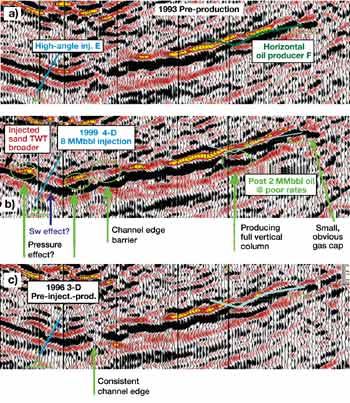
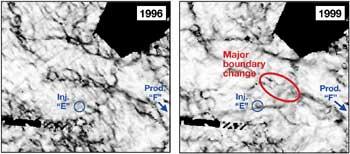
Imaging pressure-support changes. Well E injects at a high rate into the oil column (Fig. 8) and shows evidence of a similar pattern to that already described for injection Well A – namely, a regional amplitude increase (thought to be due to elevated pressure) and a local amplitude decrease around the well similar to the predicted extent of the high water saturation.
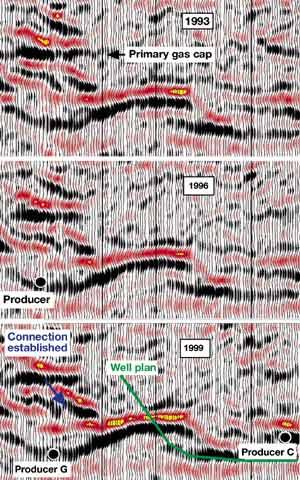
RFT pressure measurements at the time of development drilling had suggested that producer F and injector E were hydraulically connected. For its first eleven months of production, F appeared to be producing from a closed compartment, demonstrating low rates, low bottomhole flowing pressures and a high GOR. F’s production rate improved dramatically immediately before 4-D acquisition. It has since flowed at relatively consistent and sustained production rates, with an overall reduction in the GOR. At F, the 4-D seismic section shows a slight amplitude increase at the base reservoir unit. This implies vertical connectivity, but it does not show any obvious sign of an elevated amplitude-gas signal at the top of the sand. Further inspection of the 1993 and 1999 seismic data suggests a significant improvement in continuity of the top- and base-sand response (trough and peak). The discontinuity can be seen on both pre-production 3-D surveys, but appears to have "healed" on the 1999 4-D. This can be seen areally on the coherency display in Fig. 9.
Reservoir-performance data also indicated reservoir changes. Before the 4-D seismic acquisition, producer F appeared to gain no pressure support from the injector (Fig. 10), and the pressure can be matched on this assumption. However, at about the same time as the survey, pressures predicted from this model diverge from reality and can only be restored if some support is assumed to occur.
A seismic-imaging or rock-fabric explanation for such a change is not yet clear. However, it is postulated that the 4-D seismic provides a clue that a transmissibility barrier may have broken down between injector and producer, leading to F’s improved performance. Risking infill producers. 4-D seismic is being used to identify and assess uncertainty associated with infill wells. An infill producer is currently being planned at the location shown in Fig. 11. There is a large increase in seismic amplitude to the east of producer G that produces at an elevated GOR.
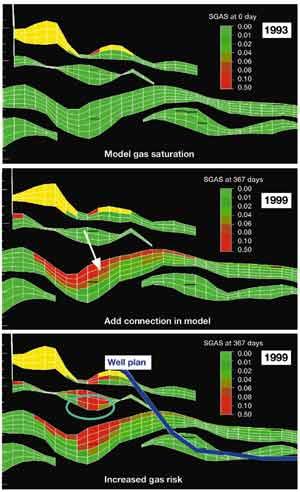
Fig. 12 shows the type of reservoir-modeling study used to understand the impact of primary and secondary gas on well productivity. Both pre-production surveys show very similar amplitude response; the 1996 amplitude is slightly lower, possibly the result of depletion from the EWT. The 1999 survey shows a significant increase in amplitude of the stack of reservoir sands around the producers and below a sand with a known primary gas cap.
The reservoir model predicted changes in gas saturation, and supported the 4-D amplitude interpretation that the gas saturation will have increased at the infill producer site; but it did not adequately represent the amplitude change due to gas in the intermediate sand. The model was, therefore, updated to include a vertical connection between these sands. The resulting gas-saturation maps look more akin to the 4-D seismic sections, but imply a higher predicted gas saturation at the wellbore. To limit this, an infill injector is planned to provide additional pressure support for the producer. Business Impact The initial stage of Schiehallion field development is now drawing to a close, but these examples show how 4-D is being used on a number of reservoir management and infill projects:
Improved sand-body mapping using different seismic illuminations. The analysis will be used to upgrade the reservoir model
Conclusions A 4-D survey was acquired in 1999 across the producing West of Shetland fields. The time-lapse survey results are very encouraging and show a good 4-D response that can be compared with the reservoir production / injection history. In this area, seismic amplitudes may be interpreted in a consistent fashion in terms of:
The 4-D results have been positive for field management and the
forward-drilling program. A comprehensive, quantitative data analysis is still ongoing to permit integration
of seismic response, rock-properties calibration, reservoir performance and model-history match. Successful
implementation of the 1999 4-D survey has resulted in a new 4-D survey being acquired this year.
Acknowledgment The authors thank BP and the Schiehallion field partnership (Amerada Hess, Shell, Statoil, Murphy Petroleum Ltd. and OMV) for permission to publish this article. The views expressed in this paper are the opinions of the authors and do not necessarily represent the official position of BP or any of its partners. Literature Cited
The authors
|


- Applying ultra-deep LWD resistivity technology successfully in a SAGD operation (May 2019)
- Adoption of wireless intelligent completions advances (May 2019)
- Majors double down as takeaway crunch eases (April 2019)
- What’s new in well logging and formation evaluation (April 2019)
- Qualification of a 20,000-psi subsea BOP: A collaborative approach (February 2019)
- ConocoPhillips’ Greg Leveille sees rapid trajectory of technical advancement continuing (February 2019)

