What's new in geophysics/ geology
What’s New in Geophysics & GeologyNew and emerging technologies help discover / manage reservoirsPerry A. Fischer, Engineering Editor
The following articles illustrate some of these new technologies:
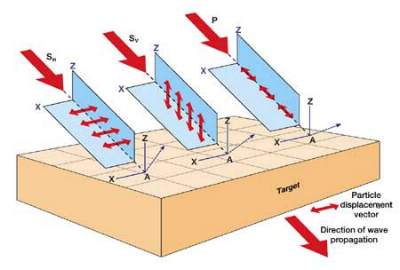
A new technology: Nine-component seismic dataThree wave modes – one compressional (P) and two shear (SV, SH) – always exist in solid earth media regardless of whether the seismic source is dynamite, vibrator or a marine airgun. A principal difference between these wavefield components is the manner in which they cause rock particles to oscillate, Fig. 1. The seismic industry is currently wrestling with the problem of how many data components should be recorded to provide new rock / fluid information at an attractive price.
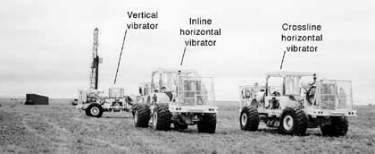
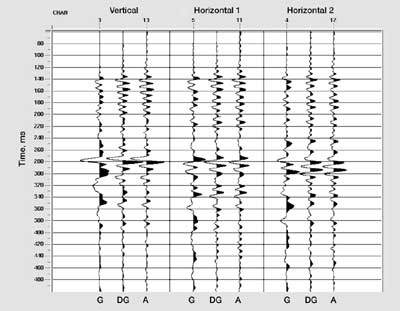
To create optimal images of subsurface targets, a seismic wavefield must first be segregated into its component parts so that a P-wave image has minimal contamination from interfering SV and SH modes. Likewise, an SV image must have no interfering P and SH modes, and an SH image must be devoid of P and SV contamination. In consolidated rocks, P-wave velocity is about twice as fast as either SH - or SV -wave velocity; this velocity difference aids in separating interfering wave modes. However, a more powerful technique for separating a seismic wavefield into its component parts is to concentrate on the distinctions in particle-displacement vectors associated with P, SH, and SV modes, Fig. 1. For this reason, procedures that segregate these wave modes by their displacement-vector characteristics are called seismic vector-wavefield imaging. Nine-component seismic. P, SH, and SV particle displacements form an orthogonal coordinate system. A fundamental requirement for multicomponent seismic imaging is that reflection wavefields must be recorded with orthogonal three-component sensors that allow P, SH and SV particle motions to be recognized. Seismic data that is recorded with only single-component sensors (either hydrophones or vertical geophones) do not allow this. In onshore seismic work, multicomponent seismic imaging can be further aided by using three oriented-vector sources that successively generate three distinct illuminating wavefields. The first source applies a vertical impulse to the earth; the second applies a horizontal impulse in a chosen direction; and the third applies a horizontal impulse that is orthogonal to that applied by the second source, Fig. 2.
The wavefield produced by each of these sources contains P, SH and SV components, as has been emphasized. However, the vertical source produces a wavefield that has a P-wave component that is particularly robust, and the horizontal sources produce wavefields with strong, polarized shear-wave components. When each of these three wavefields is recorded as successive field records by three-component sensors, the result is nine-component (9-C) seismic data, i.e., 3 sources ´ 3-C geophones = 9 components. When the reflected wavefields are recorded by a 3-D grid of three-component sensors, the data is called 9C3D data. If only one source is used with a 3-D grid of 3-C geophones, the data is referred to as 3C3D data, i.e., 1 source ´ 3-C geophones = 3 components. Why 9-C imaging? Each particle-displacement vector (P, SH and SV in Fig. 1) reacts to rock properties in a different way and thus provides different information about rock systems, pore fluids and subsurface targets. By developing technology that allows P, SH and SV images to be constructed, much more information about subsurface geology, stratigraphic relationships, lithological distributions and pore-fluid properties becomes available. To date, almost all seismic images have been made using only P-wave sources. The particle-displacement vectors P, SH and SV are defined more accurately with 9-C data than with 3-C data; thus, for technical reasons, 9-C data is preferred. However, 3-C data costs less than 9-C data, because less source activity is required to generate 3-C data. Still, many industry scientists are convinced that this new 9-C seismic information will be essential for better understanding of earth processes and for improved management of earth resources. Exploration Geophysics Laboratory. An example of industry’s commitment to further multicomponent seismic technology is its support of the Exploration Geophysics Laboratory (EGL). Located at The University of Texas at Austin, EGL’s general objective is to develop new seismic technology that can improve the understanding and management of earth systems. EGL deploys one or more 9C3D, onshore-seismic field crews on a full-time basis and investigates all aspects of 9C3D and 3C3D onshore-seismic technology and 4C3D marine technology. EGL research emphasizes new vectorized energy sources, innovative multicomponent field techniques, development of multicomponent imaging software, and demonstration of combined P, SH and SV seismic-data applications. Detailed descriptions of new reservoir-characterization
applications provided by combined P, SH and SV data are available
from the Bureau of Economic Geology as publication RI 237 (phone: 512-471-1534; E-mail:
amanda.masterson@beg.utexas.edu). The changing role of vertical seismic profilingHoward Simpson, CGG Borehole Services Division, Keston, England In areas of complex geology, recording a Vertical Seismic Profile (VSP) survey can provide a detailed, high-resolution image away from the borehole that helps in reservoir characterization. The new generation of downhole arrays, such as the digital, 12-level SST-500 receiver system from CGG’s Borehole Services Division, can provide high-fidelity four-component data (three orthogonal geophones and a hydrophone). For this type of receiver array, the primary design objective is to enable a large amount of data to be recorded in the most efficient manner. This minimizes rig time and, therefore, acquisition costs. For example, one-pass, walkaway-VSP surveys, with a recorded seismic bandwidth of up to 500 Hz, are now routine. Since all 12 levels are recorded using one surface shot, any variations in receiver response can be attributed to subsurface variations rather than changes in seismic-source output. Rationale for use. These tools have high, multichannel consistencies that give reliable estimates of rock properties such as Amplitude Variation with Offset (AVO) and anisotropy from VSP data. The idea behind estimating AVO is to position the receiver array close to the reflector of interest. By doing this, the travel path of the down- and up-going energy from a surface shot is virtually the same. It is, therefore, possible to use the downgoing wavefield for deterministic (shaping) deconvolution of the reflected wavefield, thereby removing all propagation effects caused by variations in the overburden. Any changes in amplitude still apparent in the data must then be due to angle-dependent changes in the P-wave reflectivity. These accurate rock-property measurements can be used to calibrate, for example, AVO estimates from surface seismic data and improve understanding of AVO anomalies over hydrocarbon reservoirs. Better survey geometry. Survey-geometry design that keeps the reflection angle constant allows reservoir imaging that is not possible using conventional surface seismic data. The so-called Constant Angle Profile (CAP) was designed and performed in Ekofisk field in the North Sea, where a huge gas accumulation obscured the crestal reservoir zone (Dangerfield J.A., et al., SEG, 1999). Essentially, surface shooting proceeded along a series of concentric circles around the well. For each circle, the VSP receiver-array depth was varied such that the reflection angle at reservoir level was a constant 38°. This allowed seismic energy to travel under the gas cloud and remain unperturbed by velocity anomalies that affected the surface seismic data. Better reservoir characterization. The result was an image of the crestal part of the reservoir that allowed much greater accuracy in location of further infill drilling. While successful, this work illustrated the paramount importance of 3-D model accuracy when describing lateral-velocity variations in the overburden. The velocity model is used to accurately migrate seismic events and produce a final depth image. Consequently, considerable effort has been put into travel-time tomography, i.e., the ability to alter a velocity model to match observed VSP arrival times. Starting with a simple model derived from sonic logs, theoretical travel times are compared with observed times; any mismatch is minimized using an iterative inversion scheme. This updated model is useful in itself, as well as providing clients with superior migrated reservoir images. Getting to bottom. While trying to understand the reservoir and its complexity, great emphasis has been placed on improved recovery rates, resulting in an ever-growing number of horizontal and subhorizontal wells. This has led to problems in recording borehole data along the horizontal section of such wells. Pipe-conveyed logging can be used to get the receiver to bottomhole, but this can be slow and expensive, requiring specialized electrical connection between tool and drill pipe. As an alternative, ultra-slim receiver arrays are now widely available and can be deployed on standard 7-conductor wireline yet function normally in horizontal and subhorizontal holes. PipeSeis is an innovative technique / tool that is pumped down the inside of drill pipe or production tubing until it reaches the BHA. The tool can then be retrieved by wireline, stopping at each checkshot or VSP interval to acquire data in the conventional manner. The drill pipe can be reciprocated (although not rotated) to prevent sticking while the tool is deployed, and, because the tool is always in the pipe, risk of loss or damage to the tool is minimal. Processing. Considerable success has been achieved in processing such VSP data sets, which have traditionally been problematic due to difficulties in separating up- and down-going wavefields in data from horizontal holes. But by recording data in the vertical and build-up sections of the hole, downgoing energy can be isolated and extracted from the whole data set, giving a multiple-free, upwave image.
Examples. A pumpdown SSR, slimline, 3C-VSP receiver was integrated with Scientific Drilling’s KEEPER gyro / gamma to produce a combination tool to acquire both logs simultaneously on heptacable. The service was run for the first time last fall in two wells in the Norwegian sector of the North Sea, each of 10-hr duration. The operator required both checkshot and accurate well-deviation data from both wells; running the combination tool was the most cost-effective solution. The well-deviation log was required to confirm the accuracy of MWD data, and the gamma ray provided independent verification of depth. Both operations were successful, and the operator was pleased with saving at least 20 hr per survey in rig downtime. In February of this year, the first dual-receiver PipeSeis VSP was run in a horizontal development well in the German sector of the North Sea. The horizontal-well section had a significant portion deviated more than 90°. High-quality 3C data, with a useful frequency content of more than 100 Hz, was recorded along 3,300 horizontal feet. The survey was completed on schedule without incident, and the client was satisfied with the results. An SST-500 was used to complete 17 VSP runs over 17 days in Peru for Perez Companc. These were acquired in 30-yr-old production wells, and it was necessary to repeat surveys in two of them owing to blockages. As dynamite was the specified energy source, the 12-level geophone-array tool was chosen to allow simultaneous 12-station recording of each shot to reduce the number of shot holes. The surveys would not have been economically or operationally viable using conventional VSP tools. The client was pleased with the efficiency and speed of the operation, in which no rig time was lost. Perez Companc will use the data to provide more-detailed velocity information for the area, and deconvolution wavelets will be extracted to enhance reprocessing of local surface-seismic data. Summary. Development of new hardware and improved software techniques is continuing. The company recently added the MSR four-receiver array to its pumpdown service, which can be run on monocable as well as heptacable wireline. Thus, instead of being an interesting theoretical idea, the
complex VSP is finally achieving its proper place: a routine method for deriving information
about subsurface structures and rock properties and, as such, a complement to
surface-seismic data that improves reservoir characterization.
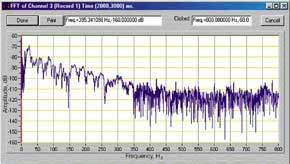
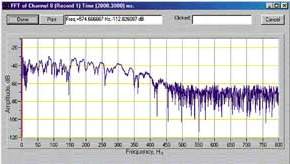
Fiber optic multi-component seismicIn what is believed to be the first of its kind, CiDRA Corp. conducted a successful field test of a fiber optic, multicomponent seismic accelerometer in December 1999. Designed for permanent installation, the three unidirectional fiber optic devices were in a three-axis orthogonal configuration. These were installed, along with a three-axis conventional geophone array, in a shallow, cased borehole at The University of Texas Bureau of Economic Geology’s Devine Test Site located near San Antonio, Texas. Experiments were performed to evaluate sensitivity, dynamic range, bandwidth, directionality and basic seismic imaging capabilities of the fiber optic device. Test results showed that performance characteristics of the fiber optic device compared exceptionally well to the geophones, Figs. 1, 2 and 3. While a geophone is the more typical particle-motion seismic-sensing device – for both surface and borehole applications – there were several reasons to pursue an accelerometer, including better durability, greater bandwidth and superior directional-response characteristics.
These attributes are critical when considering the range of requirements for installing seismic sensors in a wellbore. These include surviving the rigors of permanent or semi-permanent installation, maintaining stable performance for years and measuring various seismic wavefields – ranging from lower-frequency surface-to-borehole measurements to higher-frequency crosswell and microseismic measurements. For the last condition, successful borehole-seismic imaging must be in the presence of production-induced noise, and this requires accurate detection of polarized compression / shear waves, ranging from very small to very large amplitudes. In addition, the origins of directional microseismic events, such as those created by hydraulic fracturing, must be reliably located. These objectives place particularly challenging requirements on a suitable seismic sensor for permanent installations. The new seismic system looks promising for meeting this
challenge. The fiber optic sensors are deployed via optical-fiber cable. They are connected
to fiber optic, multiplexing instrumentation at the surface that enables multiple,
multicomponent stations in a wellbore without the use of downhole electronics. The new
sensors complement the company’s expanding line of fiber optic sensors, which already
include pressure, temperature, flow and liquid-fraction measurement.
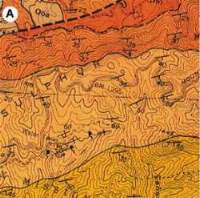
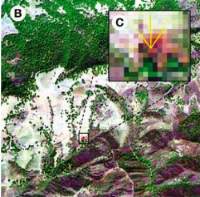
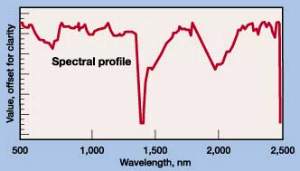
Imaging spectroscopy makes advances in explorationRemote sensing imaging spectroscopy is a relatively new tool that can identify materials by detecting specific chemical signatures. Its many uses include: mapping for land development, pollution abatement, animal habitat and mineral and hydrocarbon exploration, to name a few. Although it has been used for more than a decade, supporting technologies have advanced to the point where imaging spectroscopy is undergoing explosive growth. In simple terms, the technique relies on the application of reflectance / emittance spectroscopy to every pixel in a spatial image. Material detection depends on spectral resolution, spectral coverage and the spectrometer’s signal-to-noise ratio, as well as ground calibration, ground truthing and advanced processing algorithms. Experience in its application is also essential. Aircraft-based system. Conducted from aircraft – and soon from satellites – imaging spectroscopy (also called hyperspectral imaging) has many spectral channels compared to previous multispectral systems. An imaging spectrometer often has more than 100 spectral channels – enough to resolve absorption bands to identify materials of interest. Earth Search Sciences, Inc. (ESSI) of McCall, Idaho, recently formed a subsidiary, Petro Probe, Inc., which offers commercial imaging spectroscopy services. Its airborne, liquid-nitrogen-cooled, 128-channel spectrometers cost about $3 million each and cover the reflected solar spectrum in the 440- to 2,500-nm range. Bandwidth varies between 11 to 18 nm, while the sampling interval ranges from 12 to 16 nm; both quantities depend on the portion of the spectrum that is being analyzed (e.g., visible, near infrared, etc.). The instrument also samples broadband in the middle-infrared range of 3,000 to 5,000 nm, as well as thermal-infrared wavelengths from 8,000 to 10,000 nm. Spatial resolution can be as low as 1 m, depending on altitude. As a point of reference, humans sense light in the 400- to 700-nm range.
Looking for surface clues. Surface expressions of reservoirs have long been known. Seeps, temperature anomalies and stresses on vegetation are just a few of the surface clues that this technology can reveal. Such indicators can help decide which seismically identified prospects to drill. The airborne spectrometer can image large areas quickly at very low cost. This makes the technology ideal for reducing the areas of principal interest, thereby reducing the amount of seismic that needs to be shot. The Geosat Committee, Inc., an organization of oil and gas companies and research institutions, funded a test of Petro Probe’s spectroscopy instrument to determine its ability to detect known oil seeps on California’s Sulphur Mountain. Upon studying the data, a unique spectral signature was found that was associated with published oil seeps in the area, Figs. 1 and 2. Further, other sites nearby exhibited the same unique signature. The Geosat Committee and HJW, the company that conducted the analysis, have proposed additional research and field studies to more confidently link spectral signatures with oil seeps and stains.
The technology can be valuable in helping geologists determine the best drilling locations. The company is confident enough in its proprietary technology that it will consider taking equity positions in the properties that it identifies as holding the highest development potential. First oilfield mission. Its first mission of mapping oil seeps / stains was just completed for International Petroleum and Tolar Energy on leases in Louisiana and Texas. The mission involved 18 flight lines covering more than 440 mi2 of terrain in Louisiana and Texas. The West Scott field prospect in Lafayette Parish, Louisiana, was recently drilled to a depth of 15,500 ft, based in part on the new information. If the remote-sensing technology confirms surface indications of structure, vegetal anomalies or seepage from subsurface hydrocarbon deposits on this property, Petro Probe has the right to acquire a 5% equity working interest in this project. Satellite system. ESSI recently assumed the role of prime contractor in the Naval EarthMap Observer (NEMO) program as a result of its acquisition of Space Technology Development Corp. of Alexandria, Virginia. The NEMO satellite will be capable of capturing imaging spectroscopy of every location on earth by orbiting every eight days. The satellite is tentatively scheduled for launch in 2001. The NEMO satellite project is being jointly developed with
the Office of Naval Research under a dual-use application program, in which 75% of the
satellite’s imagery capacity is used for commercial purposes and 25% is reserved for
the Navy. ESSI will have sole commercial rights to all data generated by the satellite, and
it plans to integrate its aircraft-mounted remote sensing system with the satellite data to
give clients a complete picture of the area of interest. |
- Applying ultra-deep LWD resistivity technology successfully in a SAGD operation (May 2019)
- Adoption of wireless intelligent completions advances (May 2019)
- Majors double down as takeaway crunch eases (April 2019)
- What’s new in well logging and formation evaluation (April 2019)
- Qualification of a 20,000-psi subsea BOP: A collaborative approach (February 2019)
- ConocoPhillips’ Greg Leveille sees rapid trajectory of technical advancement continuing (February 2019)

