September 1999
Supplement
99-09_ptd_waterflood-boneau_fig1.htm (Sep-1999)
A monthly magazine offering industry news, statistics and technical editorial to the oil and gas drilling, exploration and production industry.
 |
|
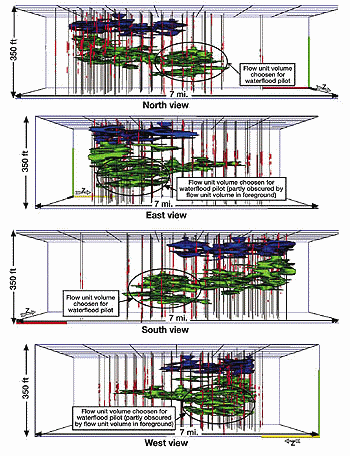
Fig. 1. Color volumes are the two largest regions of porosity greater than 6%. Pressure data indicate that these flow units are in communication through lower porosity reservoir or thin, high porosity zones. Location of the green flow unit chosen for waterflood is shown in each frame. Wellbores are in black, perforations in red. (3-D contouring algorithm with permission from KitWare, Inc.) |
FROM THE ARCHIVE
Copyright © 1999 World Oil
Copyright © 1999 Gulf Publishing Company
- Applying ultra-deep LWD resistivity technology successfully in a SAGD operation (May 2019)
- Adoption of wireless intelligent completions advances (May 2019)
- Majors double down as takeaway crunch eases (April 2019)
- What’s new in well logging and formation evaluation (April 2019)
- Qualification of a 20,000-psi subsea BOP: A collaborative approach (February 2019)
- ConocoPhillips’ Greg Leveille sees rapid trajectory of technical advancement continuing (February 2019)


