September 1999
Supplement
99-09_dynamic-walker_fig11.htm (Sep-1999)
A monthly magazine offering industry news, statistics and technical editorial to the oil and gas drilling, exploration and production industry.
 |
|
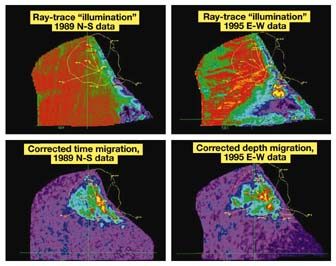
Fig. 11. Ray-trace "illumination" models of N-S vs. E-W acquisition, with corresponding amplitude maps from the corresponding velocity corrected migrations shown beneath. Light areas indicate good illumination, darker areas represent areas where few raypaths (or none) can image the horizon. While the 1989 data show attenuation trending only NW to SE, the 1995 data also shows a pronounced NE-SW line of attenuation over the SE flank of the reservoir. |
|
|
FROM THE ARCHIVE
Copyright © 1999 World Oil
Copyright © 1999 Gulf Publishing Company
- Applying ultra-deep LWD resistivity technology successfully in a SAGD operation (May 2019)
- Adoption of wireless intelligent completions advances (May 2019)
- Majors double down as takeaway crunch eases (April 2019)
- What’s new in well logging and formation evaluation (April 2019)
- Qualification of a 20,000-psi subsea BOP: A collaborative approach (February 2019)
- ConocoPhillips’ Greg Leveille sees rapid trajectory of technical advancement continuing (February 2019)

