United States: Crude oil prices
CRUDE OIL PRICES1998: A year of infamyMatthew R. Simmons, President, Simmons & Company International, Houston 1998 will surpass 1986 as the worst annual collapse in the price of oil since 1900. The average oil price in 1998 was about $.60 per barrel less than 1986 prices, before any inflation adjustment. In December, West Texas Intermediate crude averaged $11.31 a barrel. In 1986 dollars, this is the equivalent of just over $7 a barrel. And, the world’s oil stream is much heavier today, so some producers, in 1986 dollars, are getting only $4 to $5 a barrel. The following discussion analyzes this traumatic industry turn of events, explaining the basic factors that caused the price plunge, the present status and what should be done about it. Included are comments on: 1) supply and demand report confusion; 2) the "Missing Barrels" issue; 3) what happened to 1998 petroleum demand and supply; and 4) the important, inevitable effects of "depletion." The discussion then talks about what 1999 holds in store for oil markets; starting with the premise that the coming year will be filled with uncertainty on both supply and demand sides. The question of high petroleum stocks is debated, as is the critical question, "Why did oil prices fall to unprecedented low levels with actual oversupply levels at less than 1%?" And with ample evidence that world oil prices are set in the NYMEX commodity trading pits and not by real-world factors, a case is made for industry leaders to convene an energy summit to redesign how petroleum data is collected, interpreted and reported, along with serious discussion of how oil prices are now created.
What Went So Wrong? Anytime a commodity’s price falls so sharply, there is either massive oversupply or sharply dwindling demand, or a combination of both. How bad were the excesses in 1998? According to the most widely used petroleum supply and demand numbers in the world, which are produced on a monthly basis by the International Energy Agency (IEA), worldwide petroleum supply apparently exceeded demand by some 2.4 million barrels per day (MMbpd) through first-half 1998. Over the next five months, through the end of November, the excess supply fell to about 300,000 bpd, but the "damage" was already done, as bulging stocks made it hard to find places to even store the excess supply of some finished products. The IEA’s estimated oversupply is far worse than several other oil supply and demand forecasts. The highly regarded Oil Market Intelligence (OMI) report, the sister publication of Petroleum Intelligence Weekly, estimates oversupply in the first half of 1998 to be 1.47 MMbpd, some 900,000 bpd less than the IEA numbers, due to a combination of higher estimated demand and lower worldwide petroleum supply. OMI then estimated that excess supply fell to only 260,000 bpd in the five months from July to November. By December, OMI estimates show that demand finally exceeded supply by 1.9 MMbpd. Unfortunately, understanding "what went so wrong" in 1998 cannot be decided by simply figuring out which of these two supply and demand estimates are most likely to be correct. "Missing Barrels" plagues both sets of forecasts. Neither of these two highly regarded supply and demand forecasts can be reconciled by the reported buildup of petroleum inventories. For either forecast to be correct, a massive amount of Missing Barrels of oil have to be "hiding" somewhere, which is the specific term suggested by the authors of the monthly IEA Oil Market Report. The "Missing Barrels" Issue Ironically, I commented on the concept of Missing Barrels in last year’s crude oil outlook article (World Oil, February 1998). At the time, I was referring to a surprisingly large "unaccounted for crude" number embedded within the Energy Information Agency’s U.S. petroleum statistics for 1997. By June 1998, the U.S. Missing Barrels were reconciled — U.S. imports of crude oil were higher than initially estimated. But the term Missing Barrels reached a new level of importance last April when the IEA announced that over two-thirds of the massive oversupply the world was experiencing in worldwide oil supply had failed to show up yet in any observed petroleum stocks. At the time, their Missing Barrels totaled about 150 MMbbl of petroleum supplies, spread between the fourth quarter of 1997 and the first quarter of 1998. By year’s end, IEA’s Missing Barrels almost doubled in size; they also shifted entirely to the first half of 1998. In fact, IEA’s Missing Barrels for fourth-quarter 1997 was finally resolved late in 1998. It turned out that worldwide supply and demand were in balance at the time — IEA’s initial supply estimates were too high and their demand estimates too low! As of the December 1998 IEA report, there are still 275 MMbbl of "oil in hiding" that needs to finally show up somewhere, to justify the IEA’s massive oversupply estimates. Interestingly, the OMI supply and demand estimates also have similar Missing Barrels to reconcile their far lower oversupply of 1.47 MMbpd. Their Missing Barrels total 100 million for the first half of the year. And both IEA and OMI forecasts for the third quarter essentially reconcile with reported petroleum stocks, so the Missing Barrels phenomena in both sets of forecasts are limited to the first half of 1998. What this issue really means is one of three things. First, the system of measuring and reporting petroleum stocks has gone badly awry for the first time in many years. Or second, there really are 200 to 300 MMbbl of oil "hiding" somewhere with the likely hiding places being slow-steaming tankers at sea, or exotic storage caverns in places like South Africa, Sweden or even Israel. The third alternative is that the barrels did not exist in the first place. They were either never produced or consumed, or a combination of both. In my opinion, it is highly unlikely that even 100 MMbbl of petroleum stock could be "hiding," let alone close to 300 MMbbl. So, the third alternative is the most likely resolution to the issue. While Missing Barrels received very little industry attention throughout 1998, the issue remains a serious industry-wide problem that badly needs to be resolved. The mere implication that these barrels are "hiding" is partially responsible for the extremely bearish sentiment surrounding the oil markets as 1999 begins. Various oil traders warn that any up-tick in the price of oil merely encourages these barrels to come out of hiding, thus keeping oil prices low for the foreseeable future. On the other hand, if these barrels do not exist, it then means that the first-half 1998 excess oil supply was in the range of 850,000 to 900,000 barrels per day, or a mere 1.2% of the world’s daily supply base. It is hard to get most industrial markets more finely balanced than that. The sheer thought that the worldwide oil market could suffer its worst collapse in the 20th Century through such a tiny oversupply highlights the danger of pricing oil so heavily on futures contracts at the New York Mercantile Exchange. What Happened To 1998 Petroleum Demand? Declines in the growth rate for oil demand dominated the petroleum press throughout 1998. Virtually every monthly IEA report headlined further cuts in their demand forecasts. Each cut was highly publicized, fueling even more bearish oil sentiment. Final 1998 demand numbers are still subject to revision as the Missing Barrel issue awaits a resolution. Nevertheless, demand growth slowed considerably in 1998. Two factors caused this reduction. The first was the well-publicized troubles in many Asian economies. The second was the El Niño winter and its impact on dampening winter heating oil demand. Based on the most recently reported IEA demand numbers, Asian demand, exclusive of China, totaled 15.7 MMbpd per day in 1997. This still represented a growth of 500,000 bpd over 1996 Asian demand, but was 200,000 bpd less than originally forecast for the year. 1998 Asian demand is now projected to total 15.3 MMbpd. This is 1.3 MMbpd less than initial forecasts. Moreover, it represents a decline of 400,000 bpd over 1997 totals, making this the first net drop in Asian oil demand in years. It is impossible to accurately quantify the impact of El Niño on petroleum demand throughout the Northern Hemisphere. Some of Asia’s reduced demand in both Japan and Korea stemmed from El Niño’s mild winter in Northern Asia. Actual vs. initial estimates for oil demand in Europe and North America changed very little. But the economies in both areas were stronger than originally thought, so actual demand would probably have been several-hundred-thousand barrels per day higher had last winter not been so unusually mild.
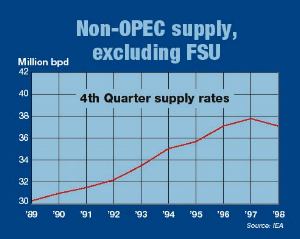
While the news on oil demand has been so bearish throughout 1998, it is important to note that 1998 demand of 74.3 MMbpd is still 600,000 bpd higher than last year and sets a new record as the highest total oil demand ever recorded. Table 1 details the changes to the IEA’s 1998 oil demand. Moreover, as recently as five years ago, many forecasters thought the world would likely see oil demand stay in the 66 to 68 MMbpd range through 2000. As recently as 1993, worldwide oil demand was still under 67 MMbpd. Oil demand growth in the past five years required more added oil than the U.S. now produces! While these high rates of growth were a wonderful elixir for many oil-producing countries, they also represented a rate of growth which could never have been sustained through added supply for another five-year spurt. So, they had to slow down. What Happened To 1998 Oil Supply? While the decreased growth in oil demand has received considerable attention throughout 1998, little notice has been paid to far greater downward revisions for non-OPEC supply. These revisions have escalated as the year progressed and now outpace the drop in demand estimates by a factor of almost four to one! One year ago, I noted in this same article how the IEA’s non-OPEC supply estimates were becoming far too optimistic. Revisions to non-OPEC supply grew throughout 1998. Non-OPEC supply estimates were reduced by 1.3 MMbpd in the first quarter, 1.9 MMbpd in the second quarter and 3.0 MMbpd in the third quarter. But the big shortfall, once again, was the IEA’s fourth-quarter, non-OPEC supply. The accompanying figure illustrates the steady rise, and fall, of non-OPEC supply (excluding the FSU). Since IEA first published its initial estimate for fourth-quarter 1998, non-OPEC supply, the number has been downwardly revised 16 different times. The initial estimate was 48.8 MMbpd. By the December 1998 IEA report, the latest estimate is only 44.66 MMbpd, a drop of 4.14 MMbpd.
Moreover, these vastly reduced numbers still appear to be too high. To achieve a supply of 44.66 MMbpd requires a jump in non-OPEC supply of 600,000 bpd over third-quarter supply rates. Already, non-OPEC production estimates for September and October 1998 are running about 700,000 bpd less than supply rates a year ago. Table 2 details these 1998 revisions. The Importance Of Fourth-Quarter Supply Rates The fourth-quarter supply rates for non-OPEC production are important. They not only create the "run rate" for oil supply outside OPEC for the next year, they have also represented the highest production rate of the year for the entire last decade. Moreover, if the collapse in Former Soviet Union supply is set aside, fourth-quarter supply has always been higher than the previous year’s fourth-quarter rate. 1998 will mark the first time in over a decade when the year-to-year, fourth-quarter supply rate is down. And the decline could be as large as 500,000 to 700,000 bpd! These stunning drops in non-OPEC supply highlight how dangerous it would have been for the world to rely on these non-OPEC supply forecasts. If the unforeseen problems of Asia had not occurred, the El Niño winter never happened, and Iraq not been either willing or able to comply with the terms of the UN food for oil conditions so it could crank its oil exports to over 2 MMbpd, the remaining OPEC producers would have been required to increase their collective production by a whopping 4 MMbpd, a rate in excess of what many observers believe OPEC could quickly do. As it turned out, Iraq accidentally became the world’s "swing producer," as projected major, non-OPEC supply gains turned into net declines. In fact, from a consumer’s standpoint, the only positive supply surprise in 1998 was Iraq’s ability to crank its production rates to over 2.5 MMbpd. Why Did Non-OPEC Supply Estimates Drop So Far? It is unlikely that the industry has ever seen a revision to petroleum estimates which comes even close to these 1998, non-OPEC supply revisions. What caused such serious drops? IEA analysts have been surprisingly silent on the extent of their non-OPEC supply revisions. Their limited discussion of these downward supply adjustments has attributed them to a host of unplanned occurrences including bad weather, new field delays, occasional accidents, and unforeseen mechanical problems from a variety of mature oil fields throughout the world. Finally, low oil prices have recently been mentioned as a final contributor to these stunning declines, though it should be noted that in most parts of the world, almost every rig capable of drilling was steadily at work almost all year. Falling rig counts will have a material impact on supply, but this will hit 1999 supply, not 1998. All of these factors contributed to some of the revised supply, but collectively, they had far less impact than depletion. What Is Depletion? There is surprising confusion about the term "depletion." Some assume it means that there is no more oil or lack of reserves. To the contrary, it merely describes the production profile of any individual oil well, or oil field, once peak production has been attained. Peak production can stay flat for some period of time but, then, decline rates always set in. There is also a major difference between "gross depletion" which is the decline rate of a field when nothing is done to halt its decline, and "net depletion," which is the ultimate decline curve even after conducting more development drilling, workover and other expenditures to increase production. What is becoming clearer as more depletion data is collected is that its growth or acceleration in many of the world’s important production basins is steadily increasing. Gross depletion rates in excess of 15% per annum are becoming commonplace. These high decline rates require a tremendous amount of drilling activity to keep net depletion as low as 10% per annum. Creating flat production in most regions of the world now requires a large outlay of exploration and production capital to offset the impact of gross depletion. The extent of this phenomenon is becoming hard to gauge. Few oil companies ever publish historical decline rates on a field-by-field basis, and even this skimpy data only covers "net depletion" after a lot of spending to attempt to halt or reverse these declines. What we do know is that the world has a curious and somewhat double focus on the production base for its current oil supply. Some 70% of current production still comes from giant fields, almost all of which are now over 30 years old. A few of the largest of these fields probably have yet to experience any serious declines. Others have been experiencing gross decline rates for years, yet are able to maintain flat production through intensive development and workover programs. The rising watercut at fields like Saudi’s giant Ghawar reservoir highlights what the next decade has in store for this critically important 70% of the world’s current oil supply. The other 30% of the world supply base comprises many far-smaller fields. These newer fields tend to peak quickly, then begin rapid declines. Many need to drain multiple layers of production to become economically viable. Some are totally drained within a matter of two to three years. As the base of older fields all start into higher decline rates, while newer fields create a perpetual treadmill condition of needing a steady increase in new-field developments to keep regional production flat, the supply problems created through depletion will almost certainly grow. How fast and at what rate the next few years’ average depletion rate becomes is the single biggest unknown factor underpinning every long-term supply forecast. Few industry analysts have even tried, so far, to quantify these depletion rates. While there are numerous published supply and demand forecasts, no one has ever attempted to quantify historical depletion rates, let alone predict what future rates might be. What 1999 Holds For Oil Markets The coming year will be filled with uncertainty on both supply and demand sides of the oil equation. Oil demand will be heavily influenced by whether the economies of North America and Europe remain in a growth mode and whether the turmoil throughout many Asian economies is bottoming out. The extent of the 1998/1999 winter in the Northern Hemisphere will also have a material impact on both 1999 demand and a badly needed liquidation of excess heating oil stocks. The latest IEA estimate for 1999 demand has it growing by 1.4 MMbpd. If this holds, demand will exceed 77 MMbpd by fourth-quarter 1999. These are not unrealistic growth rates, but there is also no way to know whether these will happen until the year has passed. Estimating oil demand is still an art form, not a science, and it takes three to nine months after a period ends before enough confirmation of demand data is recorded to know if the estimates were accurate. The supply side is quite another matter. Today’s low oil prices are forcing budget cuts by virtually every oil producer in the world. Drilling activity, which remained remarkably strong in most parts of the world through year-end, aside from major drops in the U.S., Canada, Venezuela and Argentina, will now almost certainly be trimmed in most other parts of the world. All of this threatens to cut non-OPEC supply quite sharply. How much lower non-OPEC supply could be by year-end 1999 should be a matter of intense analysis as the year progresses. OMI has already suggested that non-OPEC supply could fall by 700,000 bpd in 1999. Even this number could be too low, depending on which projects get postponed in all the budget cuts now taking place. Absent a quick upturn in oil prices, it would not be impossible for non-OPEC supply to drop as low as 42 million barrels per day by the fourth-quarter 1999. It could also take some time before meaningful drops in oil supply are reported. In the U.S., for instance, API and the EIA both still show oil supply essentially flat over the past year, while rigs drilling for oil wells have fallen to the lowest levels in more than 50 years. In 1986, the last time drilling fell so sharply, U.S. production fell by almost 800,000 bpd, but it took almost six months before really significant declines were accurately reported. At year-end, there were only 155 rigs in the U.S. drilling for oil. This is almost 50% less than previous low rates in the past 58 years, so watch for a big drop in U.S. oil supply over the coming 12 months. What About High Petroleum Stocks? In light of all the uncertainty of 1999 supply and demand, the final aspect underpinning the bearish sentiment keeping oil prices so low is reporting of high stock levels of petroleum supplies. A related problem is the continual indications that many types of storage are so full that it is getting hard to find new places to store more oil. Many oil traders look at the current U.S. crude stocks, which remain in a 330- to 340-MMbbl range, and predict that oil prices will stay low until U.S. crude supply falls back to the 300-MMbbl range. Such a stock draw might happen if supplies fall as much as some think next year. But there is also some possibility that current crude supplies are not abnormally high. If proper stock levels are measured not by total volume but by crude-to-refinery runs, then current levels are not within the average days supply of the last few years, particularly after adjusting for higher imports, which typically require a greater number of days supply than domestic production. Why Are Prices So Low? The final question all this analysis raises is why oil prices fell to such unprecedented low levels if the oversupply was only less than 1%? The answer might lie in the remarkable correlation between major moves in the price of crude and the net long or short position of the large speculators in the NYMEX crude contract. At the end of last year, the speculators had a short position almost six times the level of their long holdings of the crude contract. They remained in a net short position for all but two brief periods, once in March and once in September. During the two times when the speculators moved to a net long position before turning bearish once more, the price of crude rose by about $3.50 per barrel, before falling when, again, they switched to being short. Like it or not, the price of oil is now being set in the pits of the NYMEX. For the past two years, the closing price of the "paper barrel" each day becomes the de facto price of WTI cash prices several hours later. The two prices rarely vary by more than a penny or two. And the spot price for WTI sets the spot price for most other crude grades over the next 24 hours. The era of the paper barrel has truly arrived. Conclusions The 1998 collapse in oil prices will alter the world's 1999-and-beyond oil supply. Now, any significant upturn in demand could almost certainly not be quickly supplied. The rig shortages, which hampered many new oil projects one year ago, will only worsen as many new rig orders get canceled while people-downsizing and older-equipment retirements grow. If all this pain is finally attributed to bad forecasting data, the volatility inherent with "paper barrel pricing," and a misinterpretation of what increased petroleum stocks really mean, industry leaders need to consider convening an energy summit which redesigns how petroleum data is collected, interpreted and reported, along with having serious diccussions of how oil prices are now creaded. Oil still remains the world's largest and most important commodity. Too low of an oil
price can be as destabilizing to the world's economic health as too high a price. The former
creates an environment that leads to the latter. It is time for some serious, industry-wide
re-evaluation of how oil prices are set. And someone needs to tackle the "depletion
issue" before it is too late. The author
Copyright © 1999 World
Oil |
|||||||||||||||||||||||||||||||||||||||||||||||||||||||||||||||||||||||||||||||||||||||||||||||||||||||||||||||||||||||||||||||||||||||||||||||||||||||||
 Matthew
R. Simmons is president and co-founder of Simmons &
Company International, Houston. He graduated cum laude from the University of Utah in 1965
with a BS in accounting, and received an MBA with distinction from Harvard Business School
in 1967. He served on the faculty of Harvard Business School as a research associate from
1967 to 1969, and was a doctoral candidate at the school. After leaving Harvard, he spent
five years providing consulting and investment banking advice to a variety of clients. In
1974, he founded his present company as a specialized investment banking firm exclusively
serving the worldwide oil service industry. He was chairman of the National Ocean Industries
Association in 1996–’97, and he is a member of the National Petroleum Council and
the Interstate Oil and Gas Compact Commission, serving on the Energy Resources Committee. He
is past president of the Harvard Business School Alumni Association and a member of the
school’s Visiting Committee; and he is a trustee of the Museum of Fine Arts and the
Alley Theatre in Houston, and the Farnsworth Art Museum in Rockland, Maine. He serves on the
boards of United Meridian Corp., Pilko & Associates and PanEnergy Corp. Mr. Simmons is
well-known for his presentations at many industry meetings and seminars. His publications
appear frequently in World Oil and other oil/gas industry journals.
Matthew
R. Simmons is president and co-founder of Simmons &
Company International, Houston. He graduated cum laude from the University of Utah in 1965
with a BS in accounting, and received an MBA with distinction from Harvard Business School
in 1967. He served on the faculty of Harvard Business School as a research associate from
1967 to 1969, and was a doctoral candidate at the school. After leaving Harvard, he spent
five years providing consulting and investment banking advice to a variety of clients. In
1974, he founded his present company as a specialized investment banking firm exclusively
serving the worldwide oil service industry. He was chairman of the National Ocean Industries
Association in 1996–’97, and he is a member of the National Petroleum Council and
the Interstate Oil and Gas Compact Commission, serving on the Energy Resources Committee. He
is past president of the Harvard Business School Alumni Association and a member of the
school’s Visiting Committee; and he is a trustee of the Museum of Fine Arts and the
Alley Theatre in Houston, and the Farnsworth Art Museum in Rockland, Maine. He serves on the
boards of United Meridian Corp., Pilko & Associates and PanEnergy Corp. Mr. Simmons is
well-known for his presentations at many industry meetings and seminars. His publications
appear frequently in World Oil and other oil/gas industry journals.- Applying ultra-deep LWD resistivity technology successfully in a SAGD operation (May 2019)
- Adoption of wireless intelligent completions advances (May 2019)
- Majors double down as takeaway crunch eases (April 2019)
- What’s new in well logging and formation evaluation (April 2019)
- Qualification of a 20,000-psi subsea BOP: A collaborative approach (February 2019)
- ConocoPhillips’ Greg Leveille sees rapid trajectory of technical advancement continuing (February 2019)

