Optimizing well performance with advanced flowback equipment and automated drawdown management
As unconventional oil and gas plays mature, there has been an ever-increasing push to optimize production throughout a well’s lifecycle. This need has led to the development of numerous technology advancements in the tools and analysis that we use to drill, complete and produce wells. Over the past 15 years, we have seen major changes in how unconventional wells are operated as a result of these new technologies during almost every stage of a well’s life. There is one stage that has, for the most part, been left behind—flowback and unconventional well testing.
For many operators, the flowback period has been overlooked and is seen as a necessary evil to get a well transitioned to stable production. Typically, the well data captured during flowback is low-quality as a result of outdated measurement methods, equipment and poor service quality. There is very little analysis that an engineer can perform on flowrate data measured by a tank strap and pressure data read off a dial gauge. As a result, many operators choose to ignore these vital, initial production data when analyzing their wells. In lieu of data-based decision-making, operators are forced to manage their choke and the initial drawdown of their wells, using generic procedures or historic rules of thumb.
Numerous papers have been written in every major unconventional basin, showing that the initial drawdown strategy can have a significant impact on long-term production. The reservoir and completion are particularly sensitive during this initial production period. An aggressive drawdown strategy can lead to proppant crushing, embedment and washout, as well as fines migration, resulting in less facture conductivity. The resulting less-efficient completion will lead to faster pressure drawdown and reduced long-term production. Alternatively, an overly conservative drawdown may result in lower IRR and NPV.
Revo Testing Technologies was founded to help operators navigate these challenges. Revo combines advanced, automated, well testing equipment with proprietary engineering workflows and analytics software to help operators flow their wells as efficiently as possible. By actively managing the drawdown strategy on every well, we can reach the highest initial production possible without damaging the completion and reservoir.
Automated well testing. The transition to a digital oil field has transformed measurement and data capture for most oilfield services. Unfortunately, this is not the case during unconventional flowback and well testing for many operators. Data are still manually recorded and communicated, two to six times per day, in an email or text message. These manual measurements are inherently inaccurate and typically lead to noisy and often useless data.
Outdated, manually controlled separators and manual measurements have the additional problems of not only being unsafe for the personnel on location, but they are also an ESG nightmare. Traditional separators operate their control valves by venting produced gas, and every time a field hand measures flowrate by checking tank levels, more methane is vented to the atmosphere. The amount of emissions released may be as high as 3.5 metric tons/day of CO2e on a six-well pad.
To tackle these issues, Revo designed a next-generation, automated flow-testing package. With an automated package that is fully electrically controlled, we can help reduce the safety risks and ESG impact during flowback and well testing. These packages can be controlled remotely, and measurements are all captured digitally. Automated digital measurements can help reduce data noise by up to 75% and also reduce the time spent by personnel in the hot zone.
In designing an improved automated separator to capture better-quality flowback data, we also created a system that can increase oil volumes. Traditional manual separators do, at best, an adequate job of separating fluids, but changing well conditions and field operator mistakes can lead to rejected oil loads and oil carry-over to water disposal. As much as 2.5% of water volumes on location may, in fact, be skim oil. The Revo automated system can reduce those oil losses by up to 80% and eliminate any rejected oil loads. With an automated control system continuously managing the separator, we achieve improved separation efficiency, leading to better-quality data and more oil revenue for operators.
Flowback and production management software tools. Providing manually recorded data periodically to operators in emails or text messages is an archaic process, better-suited to the oil field of the 1990s. As a result, managing the choke and drawdown strategy for each new well is a data management and calculation-intensive process that most engineers don’t have the time to perform. The team at Revo has experienced these challenges first-hand, combing through Excel files of flowback data, each in a different format and often riddled with data entry errors.
We first created the Revo iQ software to make our own lives easier and to speed up the time-demanding process of monitoring and analyzing well data throughout each day. We have made Revo iQ available to our clients, to optimize their operations and allow them to manage the drawdown of multiple wells at once in just minutes. An example dashboard from Revo iQ is in Fig. 1.
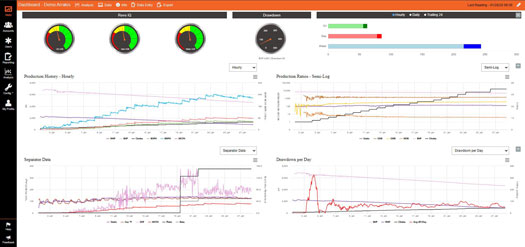
Revo iQ gives operators the ability to view a live stream of flowback and well test data from any source, including Revo’s automated well testing system, any third-party field measurements or the operator’s own SCADA systems. These data can be exported easily or linked directly back to any other software program or database. We can further simplify flowback surveillance with easy-to-use web-based interfaces and mobile applications, including an automated notification system. Engineers should be focused on analyzing data, not compiling it or managing quality control.
Unlike most production management software tools that were designed primarily to help with production accounting, Revo iQ was designed specifically to help engineers manage drawdown and understand the associated reservoir impacts. Data visualization tools have been included to help quickly assess the progress of your flowback and also compare well results with other live and legacy wells. However, visualizations of raw production data are not sufficient to truly understand drawdown impacts. To understand reservoir impacts, further analysis and data transformation are required.
Analysis of early production data may require licenses for two to three software packages, and data juggling between them can take hours. The early production period for unconventional wells is the most volatile and can require continuous surveillance. To try and understand how well performance is changing on multiple wells throughout the day is a very time-consuming process. To help operators manage this process more efficiently, we created a series of automated analysis tools and simplified KPIs called RAPD and APEX.
These tools were created to help automate the analysis methods and workflow that Revo has developed to manage initial drawdown. If downhole gauge data are not available, Revo iQ will automatically calculate bottomhole pressure as data stream in. The RAPD tool will then perform an automated analysis to provide a real-time evaluation of how well performance is changing over time and from choke change to choke change. APEX will, at the same time, determine the peak well performance seen thus far, and provide guidance on how current performance compares to the maximum. Using easy-to-understand visualizations of this analysis, operators can understand instantaneously how, and when, to adjust their choke, to preserve fracture conductivity while also ramping up production as quickly as possible.
Case study: Increasing production and reducing proppant flowback. Revo recently had the opportunity to perform a comparison test, utilizing our advanced flowback equipment, the Revo iQ software and engineering capabilities. An operator in the Eagle Ford shale’s gas window had experienced high sand rates during flowback and lower-than-expected long-term production on wells with high IP rates. Revo was asked to come in and help manage one of two wells on a pad, to compare our results to the operator’s current internal workflows.
The two wells had the same cluster spacing and stage length, with only a minor difference in fluid volume pumped. The operator’s strategy involved opening the well at a faster rate early in the flowback, and the well was quickly brought up to an initial water, nearly triple that of the flowback strategy employed by Revo.
When a well is first opened, the proppant is being held in place in the fractures by a certain amount of confinement stress. This confinement stress is the difference between the pressure inside the fracture and the minimum horizontal stress, or closure stress, commonly acquired from a DFIT. The pressure inside the fractures can be estimated by determining the bottomhole pressure before the well starts flowing. In our experience, it is common to see confinement stress of less than 300 psi on wells that don’t have a gas head in the vertical section. By flowing wells at too high an initial rate before the confinement stress has a chance to build, it will be more likely that proppant will be mobilized out of the fractures.
Tracer and other production logging data have shown that when a well first starts flowing, we will typically see heel-dominated production. This means that the initial flowrate is not coming from the entire lateral, but likely only the fractures closest to the heel. If the confinement stress holding the proppant in place is low, and the flowrate from those heel fractures is high, we will see proppant washout, right at the point where the fracture meets the wellbore. An important point to note, though, is that we may not see this proppant produced at surface immediately. The flowrate has to be high enough to move that proppant in the lateral and lift it to surface.
The most commonly used proppants (100 mesh or 40/70) can be lifted up 5.5-in. casing, when a well is flowing, at approximately 40 bbl of water/hr. Reaching this rate at surface may not lead to immediately seeing proppant washed out downhole. It is more common to see proppant at surface later with higher rates, but that rate at surface isn’t a very good indication of what the rate is at each fracture in the lateral. In theory, the fluid velocity will decrease from heel to toe along the lateral, and that velocity will increase over time. We will only start seeing proppant at surface when the fluid velocity is high enough at each stage to move proppant along the lateral and up the vertical section.
This means that there is not necessarily a direct connection between the proppant seen at surface and the current surface flowrates. Therefore, it is most likely too late to save fracture conductivity by adjusting the choke or drawdown in reaction to the proppant seen at surface.
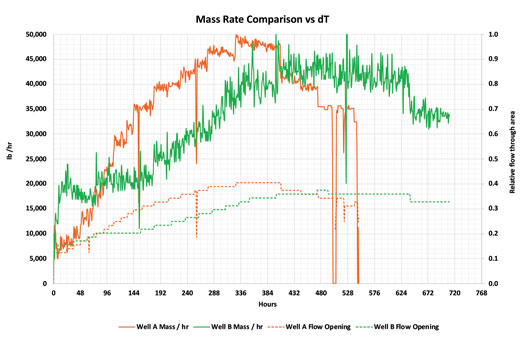
The plot in Fig. 2 shows the mass flowrate produced per hour and the relative flow through area for two comparison wells. During the first four days of flowback, Well B produced at a higher mass rate and a higher choke setting, compared to Well A. However, Well A subsequently flows at a higher mass rate and choke size for most of the remaining initial production period. From this chart, you may assume that Well A would produce more proppant and have a more aggressive drawdown, but this is not the case.
The sand rate on Well B was higher for the majority of this test, and Well B ended up producing approximately 6,450 lb of sand versus 2,820 lb for Well A. The choke and drawdown strategy deployed on Well A by Revo was optimized in real time to draw the well down more carefully while confinement stress was building. Once the RAPD and APEX tools indicated that we could open the well more aggressively, we were able to achieve higher production rates, compared to Well B.
Sand production is merely a symptom of an overly aggressive drawdown strategy; the core problem is decreased fracture conductivity and ultimately lower production and EUR. While it is nice to be able to reduce the amount of sand management equipment at surface and potential damage to production facilities, what we are truly striving for is better overall well performance.
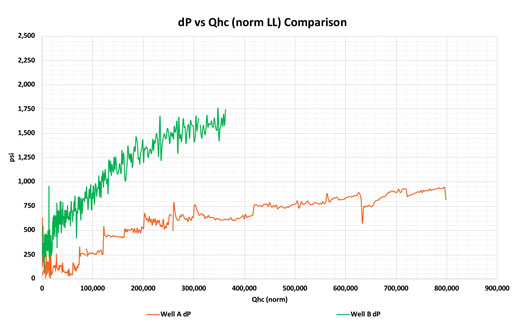
For these two wells, it was evident, even after 30 days, that Well A would be a better performer, with cumulative gas production over 50% greater. Even cumulative production doesn’t tell the entire story. Figure 3 shows a plot of pressure drawdown (dP) versus cumulative mass of hydrocarbon produced, normalized to lateral length (Qhc). This plot demonstrates that Well A not only produced more hydrocarbon over the same time period, but also did so with significantly less drawdown.
CONCLUSION
It is time to bring flowback and initial production management into the 21st century. Operators should expect a higher standard from the service companies put in charge of managing their wells during this critical stage. With better data quality, advanced analysis and a software tool to tie everything together, operators can move beyond generic procedures or simple rules of thumb to manage initial drawdown on their wells. Making decisions about how to manage the choke and drawdown in real time doesn’t need to be a time-consuming process. Revo is excited to be at the forefront of providing these new tools and technologies to allow operators to tailor a drawdown strategy for every well, to optimize production and EUR.

- Regional Report: Brazil reaches for new heights in 2026 (March)
- What's new in production: Things go better with Coke (February)
- Before OPEC, there was Texas: A better path for Venezuela’s oil revival (February)
- International E&P shows the way forward (February)
- State of digitalization in the oil and gas industry (February)
- Rugged, explosion-proof computers safeguard offshore rigs (January)
- Subsea technology- Corrosion monitoring: From failure to success (February 2024)
- Applying ultra-deep LWD resistivity technology successfully in a SAGD operation (May 2019)
- Adoption of wireless intelligent completions advances (May 2019)
- Majors double down as takeaway crunch eases (April 2019)
- What’s new in well logging and formation evaluation (April 2019)
- Qualification of a 20,000-psi subsea BOP: A collaborative approach (February 2019)

