Improved completion economics through real-time stimulation monitoring
In 2018, an eight-well pad was completed with the intention of immediately drilling and completing a second, directly offset eight-well pad. Further options for additional wells would be evaluated, based on the performance of these 16 wells. The laterals of the project wells were arranged in a wine-rack configuration, targeting zones in the Upper and Lower Eagle Ford formation. Initial designs were based on analytics from the area, resulting in an initial design for cluster spacing, stages per cluster, injection rates and volumes, and fluid volumes. The primary goal of the diagnostics expenditure was to improve the dollars/bbl relationship, specifically by increasing stage lengths that could be completed effectively along the lateral wellbore.
SETUP
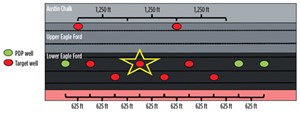
The project involved a series of wells in the Eagle Ford formation. A single pad of eight wells was developed in a wine-rack configuration, targeting multiple zones within the lower and upper Eagle Ford formation, Fig. 1. This was a joint integrated asset management project between the well operator and the service provider. The fiber optic well is in the middle of the multi-well pad. The fiber optic well was selected to be part of the first zipper pair to attempt to maximize the impact of learnings on the other wells to be completed on the pad.
Initial cost estimates for the project were approximately $1.1 million to $1.5 million. This included all equipment, man-hours, and processing for the fiber optic itself, and ancillary expenses, such as oriented perforating and rig time. Justification for the project resulted from the estimation that a 1% to 5% improvement on the rate of return (ROR) for the development of the upcoming wells would cover the initial capital expenditure and provide sufficient returns on the remainder of the wells in the program.
PERMANENT FIBER OPTICS
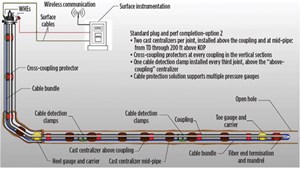
Permanent fiber optics were installed on the outside of the casing string and cemented in place, along with pressure gauges, Fig. 2. Installation occurred at the end of 2017 over a period of two to three days. Cable location was mapped, using a metal anomaly tool and oriented perforations planned for each stage of the project, in coordination with the operator.
This permanent fiber provides monitoring for the life of the well along the entire length of the wellbore.
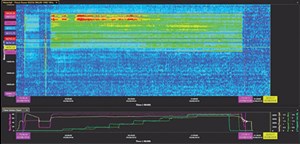
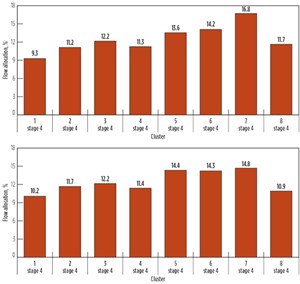
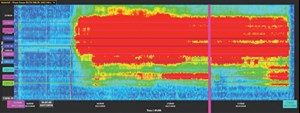
During stimulation, real-time fluid distribution was recorded along the wellbore for each cluster, using distributed acoustic sensing (DAS), Fig. 3. In addition, cross-well interference during the offset well treatment was recorded with DAS and distributed temperature sensing (DTS). It is important to note that the raw acoustic information from the DAS was processed, using an empirical flow model developed to account for fluid types, proppant types, cluster erosion, and other real variables, Fig. 4.
Fluid distribution results are provided during stimulation. Project data were recorded, processed and delivered to stakeholders, allowing for decisions to be made prior to subsequent stages or stage groups. In addition, analytics were compiled during the project, to allow for the comparison of stages along the project.
DESIGN OF EXPERIMENT
The design of the experiment is critical to the successful learning of any project. This is an iterative and collaborative process between the operator and service company, more so when changes are made real-time during a changing, dynamic design of the experiment (as was performed for the project).
The fiber optic project began with the expressed goal of maximizing rate of return by increasing production and lowering cost. Increasing production would come through the understanding of cluster level stimulations, defining stage level production drivers, and optimizing cluster slurry quantities and well spacing density. Reducing cost would be achieved by efficiently stimulating more rock per stage, reducing well interventions, and realizing fewer ancillary costs.
From a practical standpoint, these goals would be achieved through real-time monitoring of cluster-level fluid injection during the completion, and stage-level production for the life of the well recorded via DAS and DTS. Prioritization was also given to any changes that could be immediately applied to subsequent completions.
Prior to completion of the fiber optic (FO) well, it was decided to hold several variables as constant as possible throughout all trials.
- Proppant and fluid volume per cluster would be held consistent.
- Cluster spacing, defined as the lateral distance between the bottom of a perforated cluster to the top of the prior perforated cluster, was also held constant.
- Maintaining a constant cluster spacing, as well as proppant and fluid volumes per cluster, subsequently maintained a constant proppant pound and fluid volume per lateral foot across all experiments.
The agreed cluster spacing was 22.5 ft. At the time of this trial, this was a conservative spacing that considered analytics for the area and resolutions of the existing FO systems. Since the discussed trial, further development in DAS technology has resulted in the capability to definitively see activity with tighter cluster spacing. Holding these variables the same removed any potential bias for increased production, due to any individual trial or part of the lateral. It also allowed the completions team to focus on the primary goal of optimizing perforation designs.
Another necessary decision prior to the completions was the sample size of each experiment to effectively draw conclusions. The target sample size was set at eight stages, which should be enough to reduce the effects of geological changes, as well as the occasional statistical outlier.
COMPLETIONS
The initial set of stages was completed, as per the current standard design of the operator. Eight clusters were placed at the aforementioned 22.5 ft and a rough plug-to-plug spacing of 180 ft. Several iterations of this configuration were run, with varying numbers of perforations per cluster. We observed that the initial perforating design allowed for effective coverage of all 180 ft; however not all clusters were necessarily evenly treated.
As the eight cluster trials progressed, perforations per cluster were reduced to test the effects of extreme limited entry. Experimentation resulted in marginal improvements in how even the treatment was spread among the eight stages. The secondary objective, as laid out by the asset team, was to stimulate more rock per stage by increasing plug-to-plug spacing while maintaining the effective treatment covered as observed in the baseline test, reducing well interventions, and realizing fewer ancillary costs. Utilizing the learning from the baseline tests, perforations per cluster were reduced as cluster count increased, when flow results indicated an acceptable level of distribution of fluid and proppant among the clusters. Additional clusters were added in sets of two or four. To achieve acceptable distribution, completion execution variables were adjusted as well, including but not limited to, pad volume, fluid viscosity, sand staging, and diversion.
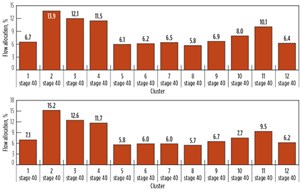
The methodologies used to grade trials as completions progressed were both statistical and observational. While the FO analysis provided a percentage of fluid and proppant observed at each cluster (Fig. 5), the intra-stage evaluation of flow distribution by cluster with time was invaluable to determine cause and effect relationships. Statically, the goal was to observe uniform fluid and proppant distribution across all clusters with in a stage. To better compare stages, standard deviation of cluster flow from the desired flow of each cluster was utilized. For a better visualization, the sample standard deviation was equated to pounds of proppant per cluster. The distribution effectiveness formula (Eq.1), was used to calculate the percentage of proppant flow for each cluster provided by DAS analysis for each stage.
 (Eq.1)
x = desired flow/cluster (100%/number of clusters)
Xi = Observed flow (each cluster)
N = Number of clusters
This figure was then multiplied by the desired proppant per cluster (45,000 lb)
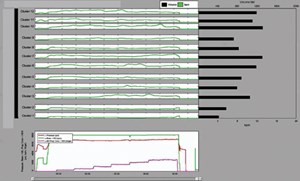
The post stage distribution and stage-based analysis could not be the sole analytical tool, Fig. 6. Much was learned from the intra-stage cluster flow distribution, itself, from each stage, Fig. 7 and Fig. 8. The statistical variation made it simpler to do a quick comparison and ranking of each stage and trial, but without the visual aid of the DAS plots, the reasons for uneven treatments could not be realized. The back pressure achieved with limited entry perforating designs did well to establish flow into all clusters but did not maintain an even flow. As proppant was added to the treatment, erosional forces on the perforations led to an uneven treatment. Furthermore, as steps in larger proppant concentrations were taken, we saw dynamic shutting off and intensifying of acoustic activity in already established clusters. These effects led to uneven treatments and “runaway” clusters.
It should be noted while the main experiment revolved around increasing clusters and variations in the perforating design, chemical changes were made in smaller sets along the way. We observed the effects of hydrochloric acid and particulate diverters on cluster efficiency. Chemical changes proved to be less effective than limited entry at evenly treating large numbers of clusters.
Variations in treatment rate, pump schedule, and perforations per cluster were refined as the number of clusters increased. Eventually, diminishing returns were realized by increasing cluster counts.
RESULTS
The number of clusters effectively stimulated in a single stage grew from the baseline of eight to 12.
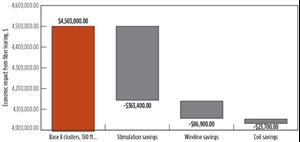
In many cases, 12-cluster designs were more evenly treated than the baseline eight clusters. The economic impact of increasing the stage length by 50% is significant. When factoring in wireline and perforating, plug, and stimulation costs, an overall savings of 15.9% was realized. There is also a significant time-savings; completion time is reduced by greater than 10% per well, Table 1. Specifically, savings are attributable to reductions in stimulation, wireline, and coil costs for a given well AFE, Fig. 9. Results also indicated that additional experimentation could result in clusters being added and those experiments are currently being pursued.
PRODUCTION
Completions designs developed during the fiber project were immediately taken to subsequent wells to capture the impact of reduced completions costs. The decision was not made without understanding risk, and production data was going to be immediately collected to validate this decision.
Production for the fiber optic well and its completion zipper twin were comparable to type curves for production in the area. In addition, stage-level production and decline curves built from the DTS data showed favorable comparisons between the 12-cluster stages and initial eight-cluster stages. Production is being actively collected (cumulative production curves for each cluster) and compared to confirm completion decisions.
CONCLUSIONS
A single fiber-optic equipped well was successfully installed, completed and processed to provide immediately useful feedback on completion designs. By the end of the evaluation, those changes were applied to the next wells, resulting in lowered costs, increased production, and improved ROR. The success of the project depended on the coordination of completion engineers, data analysts, technical professionals, fiber analysts, wireline engineers, and operations teams from both stakeholders.
Significant was the ability to increase the effective stage length by a factor of 50% and produce an equivalently performing well, in the case of the FO well, itself, and improved wells afterwards.
At the end of the project, completions changes resulted in a reduced individual well cost of 11%.
Production profiling was performed to compare stage designs along the lateral and to confirm baseline well performance versus its peers. In both cases, those results confirmed that the design changes lowered the overall cost while maintaining well performance. WO
- Digital transformation/Late-life optimization: Harnessing data-driven strategies for late-life optimization (March 2024)
- The reserves replacement dilemma: Can intelligent digital technologies fill the supply gap? (March 2024)
- Digital tool kit enhances real-time decision-making to improve drilling efficiency and performance (February 2024)
- Digital transformation: Digital twins help to make the invisible, visible in Indonesia’s energy industry (January 2024)
- Digital transformation: A breakthrough year for digitalization in the offshore sector (January 2024)
- Quantum computing and subsurface prediction (January 2024)

