FARID SHECAIRA, DALMO BARROS, KARTIK RAMACHANDRAN, GEORGE BONIN and PAULO WALTRICH, Petrobras America; DAVID JENNINGS and MIKE NEWBERRY, Baker Hughes; and CLAUDIO ZIGLIO, Petrobras Cenpes
 to inject the dispersant, and a second vessel (right) to process the effluent.") |
| Remediation of paraffin in the crude oil produced at the platform required the use of a pressure pumping vessel (left) to inject the dispersant, and a second vessel (right) to process the effluent. |
|
Cottonwood is the first field development in the deepwater Gulf of Mexico operated by Petrobras, consisting of three subsea wells in water depths of 2,200 ft. Two wells produce gas-condensate, with high wax deposition potential. The wells are connected to a fixed platform in East Cameron Block 373, 17 mi away, through a piggable loop with flowlines of 6 in. nominal and 4.8 in. ID. During a pigging procedure in December 2007, a rigid, 5.1-in. elastomer pig got trapped halfway in the East segment of the loop, after traveling through the West segment. In front of the pig, a slug of paraffin was formed and impeded its passage.
During two subsequent years, output continued through the still-open West segment of the production flowline. A wax mitigation plan was implemented, consisting of continuous paraffin inhibitor injection with periodic batch solvent treatment. Meanwhile, low-cost, advanced technology-based methods to remove the obstruction were pursued, as an alternative to the high-cost, whole or partial East flowline substitution. The procedures attempted were, first, the controlled pressurization of the flowline, and second, application of associated vibration and pressurization. These methods, along with paraffin solvent soaking procedures, helped to release the pig in February 2010, making both segments available for production. However, a layer of wax was formed inside the flowline loop and pig fragments could still be present in the East segment.
An operation was performed to further clean both flowline segments, which consisted of injecting sea water mixed with a paraffin dispersant. The operation was one of the first paraffin dispersant applications for cleaning a deepwater subsea tieback. The formulations used were thoroughly laboratory-tested. The operation demanded noticeable logistics planning and execution, due to the deepwater environment and large volume of seawater and chemical needed to circulate through the 4,000 bbl internal volume of the flowline loop. The operation was a success, thereby allowing the restoration of production with full flowline-diameter availability and the resumption of routine pigging of the loop.
PRODUCTION BACKGROUND
Cottonwood field is located in the Garden Banks quadrant, Block 244, in the American sector of the Gulf of Mexico, 139 mi off the Texas coast. The field consists of three wells completed in water depths of approximately 2,200 ft. Wells No. 2 and No. 3 had been completed have been completed to produce a gas-condensate reservoir, with high paraffin deposition potential, and Well No. 5 was completed in a heavy oil-bearing reservoir. Table 1 shows some of the fluid properties of the gas condensate fluids in Wells 2 and 3. Well No. 3 condensate presents values of wax appearance temperature (WAT) and paraffin content higher than the other two wells. The mixing of the higher asphaltene content, heavy oil of Well No. 5 with the lighter oils of Wells No. 2 and No. 3 presented an asphaltene flow assurance concern. For this reason, Well No. 5 was shut-in, just after its completion, for further studies on the compatibility between the three different fluids.
| Table 1. Cottonwood oil properties |
 |
The wells produce to a fixed platform located in shallow water at the East Cameron Block 373 (EC 373), through the subsea arrangement, Fig. 1. All the subsea equipment is rated to stand pressures up to 15,000 psi.1 The wells produce through a piggable loop constituted by two rigid flowlines of 6-in. nominal OD and 4.8-in. ID, approximately 17 mi long. The two producing flowlines communicate through a jumper between two Pipeline End Terminations (PLETs). Wells No. 2 and No. 5 produce to the West PLET, while Well No. 3 produces to the East PLET. The fluids are treated at EC 373, and the gas is flowed through the Stingray gas line. The oil flows to platform GB 72 through an 8-in. nominal diameter pipeline, and from there to the Cameron Highway Oil Pipeline Service (CHOPS) pipeline.
 |
| Fig. 1. Submarine arrangement of the Cottonwood field |
|
FLOW ASSURANCE STRATEGY & OBSTRUCTION
The flow assurance strategy to manage paraffin deposition was to use regular pigging in conjunction with a paraffin inhibitor (PI) injected through the umbilicals. Furthermore, a low-dosage hydrate inhibitor (LDHI) was continuously injected. During programmed well shut-ins and start-ups, 100 gal of methanol, a thermodynamic hydrate inhibitor, were also injected. The production lines were buried to achieve some thermal insulation. However, due to operational obstacles, the flowlines were not buried, up to about 800 ft from the PLETS. These two unprotected flowline segments, along with the non-insulated jumpers and christmas trees, are subjected to a minimum seawater temperature of 44.6°F, which is inside the hydrate and paraffin formation envelopes. In spite of this robust strategy, in December 2007 an aggressive elastomer pig of 5.1-in. diameter got stuck in the East flowline. This occurred during a pigging operation, after the pig traveled from the platform through the West flowline, to the jumpers and halfway through the East flowline. As further operational actions to release this obstruction showed, the pig was preceded by a slug of paraffin.
After this fact, production was re-established using only the West flowline. This approach was risky because the paraffin deposition process would certainly continue to occur. To mitigate the risk of losing the West production flowline as well, an emergency flow assurance plan was implemented. Furthermore, several procedures to release the obstruction and clean the flowline were conducted during a two-year period. Other alternatives to re-establish full flow capacity were evaluated. These included, first, the East flowline removal and substitution, and second, the cutting of only the flowline segment where the obstruction was located and substitution. However, both procedures were environmentally risky, due to the fact that the flowline contained hydrocarbons, and would have cost over $30 million, which was prohibitive for this field.
PROCEDURE TO RELEASE OBSTRUCTION
Since the production of both wells was directed to the West flowline, a paraffin deposition emergency protection plan was necessary. Laboratory tests were conducted to determine an ideal PI content to be injected. The tests indicated that the PI content should be increased from 500 to 1,500 ppm. In addition, a monthly batch treatment of paraffin solvent was initiated.
The first action necessary to release the pig/paraffin obstruction was to determine its location. This was achieved with Echo-Pulse technology, developed at the Petrobras R&D Center (CENPES), which consists of the application of a pressure pulse from the platform and monitoring the return of the pressure pulse using a pressure transducer. If the propagation velocity of the pressure pulse within the fluid contained in the flowline is known, the distance between the platform and the blockage can be determined. Known singularities of the flowline, such as a line diameter change, create pressure signals that can be identified and used to calibrate the measurement process, and to better determine the propagation velocity of the pressure pulse. Using this method, the obstruction was determined to be about halfway from the East PLET to the platform, that is, about 8.5 mi from the platform. An error of about 10% was estimated for this method because the paraffin accumulated in front of the pig could be soft and contain small slugs of gas, thereby dampening the pressure pulse reflection.
Besides the chemical treatment, the obstructed flowline was pressurized up to 13,800 psi from the PLET toward the platform, using the wellhead umbilical to push ahead the blockage. Next, the flowline was pressurized up to 17,000 psi, from the platform toward the blockage. The different pressures are due to varying maximum, specified operating pressures for the umbilical and for the production flowline. Finally a “rocking” pressurization procedure, alternating pressure surges from both sides, was attempted. After each one of these procedures, the Echo-Pulse technique was applied. No significant blockage movement was detected.
Paraffin solvent soaking. During the production period, the pressure values at strategic points along the West flowline, which was open to the flow, were monitored daily to identify how fast the paraffin deposition process was occurring. Figure 2 shows a scheme of the flowlines with identification of the pig/paraffin obstruction position at the East flowline. A simulation model of the flowlines was constructed to calculate the flow temperature and the pressure profile from the well heads, along the jumper and the West flowline. An equivalent flowline internal ID was the fitting parameter for this model. Increases in pressure losses measured along the flowline were used to adjust the model by decreasing the equivalent ID, indicating that, in some segments of the flowline, paraffin deposition was building up.
 |
| Fig. 2. Scheme of the flowlines, showing the obstruction location in the East pipeline. |
|
Figure 3 shows the East PLET pressure behavior along time. Since the pressure at the separator in the platform was roughly constant, increases in the East PLET pressure indicated deposition of paraffin downstream of the PLET. The arrows in Fig. 3 show points in time when the pressure increased, which was a signal that, in one or more segments of the flowline, significant paraffin deposition was building up and starting to pose a danger to obstructing the flowline completely. To solve the problem, at least temporarily, a paraffin solvent soaking was implemented. This temporary remedy was used several times to keep the flowline open and the production ongoing until the final obstruction removal was achieved. Figure 4 shows a scheme of one of those treatments, consisting of an injection of paraffin solvent through the umbilicals of Wells No. 2 and No. 3. A volume of solvent was displaced until it reached the wellhead, the West and East PLETs, the jumper and about 800 ft from the West PLET to the platform. Next, all flow was interrupted during the soaking period. This volume was chosen to treat these flowline segments exposed to the sea temperature, and consequently, more prone to developing paraffin build-ups.
 |
| Fig. 3. East PLET pressure profile |
|
 |
| Fig. 4. Paraffin solvent soaking scheme |
|
Several parameters were adjusted to reach an optimal performance: solvent composition and concentration, soaking time, and the soaking procedure protocol. The solvent was left soaking 12 hr inside the christmas trees, jumper and the unburied portion of the West flowline. Furthermore, best results were obtained after the solvent was also injected inside the wellbore, indicating that some paraffin deposition was occurring there as well, most likely near the wellhead. This probably occurred when, due to decreased flow, the wellhead temperatures dropped to a point near the WAT. Optimizing the solvent treatment extended the time between soakings from about 10–15 days to about one month. This was achieved after November 2009, when the best treatment protocol was reached, Fig. 3. The best protocol, besides extending treatment life, also lowered the PLET pressure level.
Controlled pressurization. Two operating procedures were applied in the flowline to remove the blockage. The first procedure, called Micro Annular Pressure Pulse (MAPP)2, was employed in the Cottonwood flowline during 2008. This method consists of relaxing the flowline, followed by a very gradual pressurization. The relaxation of the pipe and the plug helps to reduce the plug diameter as much as possible. This is achieved by lowering the pressure from both ends of the flowline to the maximum extent possible, and maintaining that condition for some time. Subsequently, the pressure was slowly increased from the platform, with the objective of creating a tiny liquid-filled gap between the plug and the pipe. This is due to the expansion of the pipe diameter, and compression of the plug material, as pressure increases. At high-pressure build-up rates, the plug column collapses against the pipe, and the gap does not form. The liquid-filled gap would allow relatively free motion of the plug. Once plug movement is established, its direction is switched toward the platform by equalizing pressures on both sides of the plug, followed by slow manipulation of both the upstream and downstream pressures. System pressure could also be reduced during this process to allow safe recovery of the plug at the platform. In the case of the Cottonwood flowline, this procedure was attempted, but it did not work as expected, although it could have contributed to the obstruction release achieved later.
Vibration and pressurization method. A second procedure, Pipe-Pulse from Paradigm Flow Solutions, was applied in the East flowline in 2009. This method involves the emission of sonic pulses into the liquid stream. The flowline pressure is maintained at a given value, and pressure pulses are applied with a given frequency. These sonic pulses travel through the liquid, which fills the flowline, and their energy is transferred to the pipe wall and the blockage. Because of the different compositions of the pipe wall and the blockage, they resonate at different frequencies, thereby breaking the bond between them and allowing the blockage to be dislodged from the pipe wall.
As a result of this procedure, approximately 1,060 gal of paraffin were recovered from the flowline, but the blockage could not be removed. This paraffin was part of the slug accumulated ahead of the pig, but probably the paraffin at the core of the obstruction remained intact. This could be attributed to the fact that the energy of the pulse pressure was not adequately conveyed to the blockage due to the presence of the soft paraffin deposits, which acted as shock absorbers. The blockage position was confirmed by the Pipe-Pulse procedure, which obeys the same principle as the Echo-Pulse technology. Although not entirely successful, this technique certainly helped to release the obstruction.
Pig release. All of the actions described earlier were complemented by controlled pressurizations of the East flowline, from the wellhead, using the Well No. 3 umbilical. These pressurizations used paraffin solvent as the driving fluid, and they were made in the hope that some of the solvent could reach the obstruction if a small aperture between the pig/paraffin obstruction and the flowline walls existed. In February 2010, two years after the pig got stuck, evidence was found about the existence of this aperture. During a platform shut-in, the flowline was pressurized from the wellhead, and the pressure was drained from the platform. Thus, a high-pressure differential was established across the obstruction. After some time, the pressure between the obstruction and the platform increased slowly, indicating fluid passage through the obstruction. At this point, a series of pressurizations from the wellhead and pressure drainages from the platform were performed, forcing some solvent flow through the aperture. A total of 5,000 gal of solvent was injected. In Fig. 3, this is indicated by the pressure spikes to the right. After some time, the pig paraffin obstruction was released, and some fragments of the elastomer pig, along with some paraffin, were detected in the pig catcher, Fig. 5. Some parts of the pig, especially its magnet, were not captured at the pig catcher.
 and paraffin captured at the pig catcher") |
| Fig. 5. Pig fragments (left) and paraffin captured at the pig catcher |
|
FLOW ASSURANCE PLAN
Once the pig/paraffin obstruction had been removed and flow through the East flowline re-established, the wells were put back to production through both lines. It was necessary, however, to reduce the risk of another flowline clogging, and re-establish a flow assurance plan that would include pigging. Unfortunately, pigging the flowline again, even using a sequence of pigs with sequentially increasing diameters, would be risky, because hard portions of the paraffin slug, along with parts of the pig, may have remained attached to the flowline wall. Furthermore, the West flowline had paraffin deposition from two years of production without pigging. As a consequence of this, plans were made to clean the flowline completely and re-start periodic pigging.
Two possible strategies to clean the flowline were available—with solvents, which is more common, or with dispersants and water. The second strategy, proposed and later conducted by Baker Hughes, had an extremely limited history of applications in deepwater with none as comprehensive as this application. However, it presented several advantages. First, the dispersant could be used with seawater. This proved to make the dispersant application more economical, due to the large internal volume of the flowline, which was about 4,000 bbl. Second, in cold temperature environments, dispersants can potentially carry more paraffin than solvents can dissolve. Third, if solvent was used and the first flowline volume injected was not enough to clean the flowline, more volume would be needed, which would increase the costs even more, and make the logistics of handling such a large volume of solvent impractical. If the first flowline volume of seawater with dispersants was not enough to clean the flowline, the same water could be used again in a closed loop, and more dispersant could be added to replace the wasted dispersant used to remove the paraffin off the flowline walls. The fourth advantage of using water would be to reduce the risks to human health, as well as the environmental risks in case of a leak-off. Finally, it would be easier to monitor the results because the paraffin removed would float in the water stream coming from the washed flowlines.
Laboratory studies for chemical selection. The next step was to select the dispersant through tests conducted at Baker Hughes and at Petrobras Cenpes laboratories. A sample of paraffin deposit removed from the pig catcher was use to construct small tablets of paraffin, which in one set of testing were left for 4 hr inside beakers with a mixture of the dispersant to be tested: monoethylene glycol (MEG) and artificial seawater. MEG would be used to inhibit hydrate formation during the initial and final phases of the operation, where gas would be present in the flowline. The tablets were kept under controlled agitation and at a temperature of 59°F for 4 hr. Subsequently, the dispersant removal efficiency was calculated by weighing the tablets. The dispersant elected, mixed in seawater, had an efficiency of about 70% at a dispersant content of 5%, and 90% at a dispersant content of 10%. However, if MEG was added, the efficiency dropped to virtually zero. This fact conditioned the design of the operation.
Operational logistics. To perform the operation, it was necessary to use two vessels positioned within 80 ft of the platform, Fig. 6. The first boat provided the pumping capabilities. It was responsible for transportation and storage of the dispersant, MEG, and for obtaining and storing seawater for the operation. This vessel mixed the chemicals with water and pumped the mixtures with its high-capacity pumping units. It was hydraulically connected to the pig launcher on the platform. The second boat received the effluent from the pig receiver on the platform; separated the paraffin from the water stream; stored the paraffin; and finally, filtered and transferred the water back to the first boat.
 |
| Fig. 6. Cottonwood flowline treatment scheme |
|
Operational design. The cleaning operation was designed to have four phases. Phase 1, consisting of flowline conditioning for operation start–up, involved injecting a seawater/MEG mixture with an MEG content of 44%. The objective was to displace the flowline of production fluids and avoid the risk of hydrate formation from contact between the gas in the produced fluids with the MEG-free seawater in the dispersant/seawater treatment in Phase 2. One flowline volume of 4,000 bbl of the sea water/MEG mixture would be injected. Phase 2, consisting of chemical cleaning, involved the circulation of a mixture of the dispersant and sea water, at a concentration that could be controlled during the operation, but was intended to vary from 5% to 7.5%. During this phase, the dispersant mixture would be injected at high rates to provide turbulent flow, to promote the break-up and removal of as much paraffin as possible. The strategy was to inject as many flowline volumes as necessary to clean the flowline. The results of this phase would be monitored by visual inspection of the effluent and by running a model to evaluate the equivalent flowline ID. Phase 3, consisting of mechanical cleaning, would involve sending a series of foam pigs with sequentially increasing diameter and density. This process would clean the flowline further and assure that the flowline could be regularly pigged later. At this point, the flowline would be cleaned and filled with seawater. Phase 4, flowline conditioning for wells start-up, would consist of flushing the flowlines with seawater plus MEG. Next, gas would be injected from the platform, and finally, the wells would be opened and brought to production. This mixture of seawater and MEG would again avoid hydrate formation that could occur from the contact of gas with the sea water left from Phase 3.
Operational history. During Phase 1, approximately one flowline volume of seawater plus MEG was pumped at a rate of about 3.5 bbl/min. In this phase, residual oil associated with the paraffin deposition and small amounts of paraffin were removed with the flow and released by mechanical action of the injected fluids against the flowline walls. The bulk of paraffin deposition was, however, unaffected by the seawater/MEG displacement. The seawater/MEG mixture pumped was captured and stored in the second vessel, to be re-used in Phase 4 of the operation.
In Phase 2, the dispersant/seawater mixture was injected with rates up to 5 bbl/min., to assure good mixing of the dispersant package and turbulent flow to carry the paraffin released from the flowline walls. Approximately two flowline volumes of dispersant/seawater with a dispersant concentration of 5% were pumped. From the initial returns, it could be observed that the dispersant was removing significant amounts of paraffin. The paraffin was separated from the returns in effluent storage tanks on Vessel 2 as a slurry of sludge of paraffin, dispersant, and small amounts of residual sea water. This paraffin sludge was stored for disposal onshore after the operation. The seawater meanwhile, was filtered and transferred back to Vessel 1, where more dispersant was mixed to achieve the desired dispersant content. Samples collected from the initial returns of the operation showed high paraffinic material content. Figure 7 shows a full-stream sample shortly after sampling, while Fig. 8 shows paraffin collected in an effluent storage tank.
 and foam over water") |
| Fig. 7. Mixture of oil and paraffin over water (left) and foam over water |
|
 |
| Fig. 8. Paraffin collected from return effluent storage tank on Vessel 2 |
|
The main operational problem during Phase 2 was foaming in the returns. A thick foam formed and collected in the effluent storage tanks of Vessel 2, which became problematic as the five effluent tanks, connected in series, filled as the operation proceeded. To provide extra time for foam breaking in the effluent storage tanks, the pumping rate was reduced to 3 bbl/min. At this point, the fluid returns showed dramatically diminishing amounts of paraffin. For this reason, the dispersant concentration was increased to 7.5%, to ensure that the dispersant would remove as much paraffin as possible before Phase 3. The volume pumped was about one-quarter of the volume flowline. Since little extra paraffin was being removed, Phase 2 was considered finished at this point. About 900 bbl of the paraffin sludge were collected in Phase 2.
During Phase 3, only seawater was injected to push the series of foam pigs with sequentially increasing external diameters and densities. A total of six pig rounds was displaced. In each round, a pair of pigs was pushed, with high seawater flowrate. The first round had one 2-in. LDCC (low-density crisscross) elastomer pig, followed by a 3-in., low-density swab pig. The pigs reached the pig catcher in pieces, bringing about one gallon of paraffin. Next, two 4-in. pigs were sent—one LDCC and one swab. During the pigs’ trip, pressure surges were detected at the pumping unit, indicating paraffin accumulations ahead of the pigs. Compacted, relatively hard paraffin reached the manifold of the treatment equipment and was captured at the pig catcher. However, the pigs were again destroyed, probably at the catcher metal net.
A new round, identical to the previous one, was sent. No paraffin was displaced. Rounds 4, 5 and 6 followed with 5-in. pigs. Round 4 was comprised of a LDCC and a swab low-density pig, which brought about 16 gal of soft paraffin. In Rounds 5 and 6, the density of the pigs was increased to medium. These rounds brought a small volume of paraffin to the pig catcher. In Round 6, the MDCC (medium-density crisscross) pig had lateral metal scrapers. These pigs arrived intact at the pig catcher. During these six rounds, a total of six flowline volumes were injected. The sixth pig round was pushed with the stored seawater/MEG mixture. This started the final Phase 4—flowline conditioning for well start-up. Following one flowline volume of the seawater/MEG mixture to displace the sixth pig, a small MEG pill was pumped to complete the operation. Next, for production restart, natural gas was compressed from the platform to condition the flowlines for the start-up of Wells No. 2 and No. 3.
MODEL USED FOR FLOW SIMULATIONS
Calculations of the equivalent internal diameter of the flowlines were performed prior to the cleaning operation, using complex, multiphase flow commercial simulators, with production and pressure data as input. The equivalent internal diameter of the flowlines evolved from 4.7 in. in the West flowline and 4.2 in. in the East flowline when they were new, to 2.2 in. in the West flowline and 2.7 in. in the East flowline, calculated before the cleaning operation began. To calculate the equivalent ID of the flowlines during the cleaning operation, for assessing the treatment effectiveness, a simpler, thermo-hydrodynamic single-phase model was developed to be used in real time, during the cleaning operation. The model was also used to help in the hydrate analysis, providing the flowline pressure profile as a function of temperature of the flowing fluids. The flowline pressure profile was calculated, based on the steady-state Bernoulli’s equation, neglecting the acceleration component, as follows:
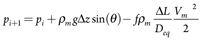
where p is pressure (Pa), ρm is average density of the flowing fluids (kg/m3), g is the acceleration due gravity (m/s2), Δz is the flowline height increment (m), Θ is the flowline increment inclination (degrees), f is the Fanning friction factor, ΔL is the flowline length increment, Deq is the equivalent internal diameter of the flowline, and Vm is the mean velocity of the flowing fluids inside the flowline.
The temperature profile was obtained using an energy balance equation for the flowline's internal flow and its surroundings:2
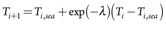
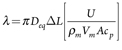
where T is temperature (K), U is the heat transfer coefficient between the flowing fluids inside the flowline and its surroundings (W/m2K), A (πDeq2/4) is the cross-section flowing area (m2), and cp is the average specific heat for the flowing fluids.
The calculations were performed using a marching approach, e.g., the calculation of the next node is obtained using the values of the previous node. The flow rates, inlet, PLET and outlet pressures, and temperature of the fluids being injected, all measured, were used as input parameters to calculate the equivalent ID of both West and East flowlines.
Calculations were performed during the cleaning operations, showing how the equivalent ID of both flowlines increased gradually. After Phase 1, both flowlines showed IDs of 3.5 in., and after Phase 2, the values were around 4.6 in. for both flowlines, confirming a successful cleaning.
CONCLUSIONS
This deepwater case history shows, first, that pressurization methods, associated with solvent usage and non-conventional technologies, can release pig/paraffin obstructions, which are fairly common in such an environment. Second, the article describes the flowline cleaning procedure. The flowline cleaning was especially challenging, due to the large flowline internal volume and the long tie-back distance. The flowline cleaning procedure was one of the first paraffin dispersant applications used in deepwater. The cost of both actions, that is, releasing the pig/paraffin obstruction and cleaning the flowline, was accomplished at a cost of approximately 12% of the cost of flowline substitution. 
LITERATURE CITED
1. Kakaç, S. and H. Liu, Heat Exchangers: Selection, Rating and Thermal Design, Second Edition, CRC Press, 2002.
2. Bilyeu, D. J. and T. X. Chen, “Clearing hydrate and wax blockages in a subsea flowline,” paper OTC 17572, presented at the Offshore Technology Conference, Houston, Texas, May 2-5, 2005.
ACKNOWLEDGMENT
The authors thank Petrobras America, Baker Hughes and Paradigm Flow Solutions for the permission to publish this article, based on paper SPE 146156, presented at the SPE ATCE in Denver, Colorado, Oct. 30–Nov. 2, 2011.
|
AUTHORS
|
 |
FARID SHECAIRA is the manager of production, reserves and reservoir for Petrobras in the international area. Dr. Shecaira holds a BS in civil engineering from the Universidade de Sao Paulo, Brazil (1979), MSc from the Universidade Federal de Ouro Preto, Brazil (1988) and PhD from the University of Texas at Austin (1998), both in petroleum engineering. |
|
 |
DALMO BARROS is manager of production operations and control at Petrobras America. Mr. Barros holds a mechanical engineering degree from the Universidade Catolica do Rio de Janeiro, Brazil (1979) and a specialization in petroleum engineering from Petrobras University (1981). |
|
 |
KARTIK RAMACHANDRAN is a production engineer at Petrobras America specializing in flow assurance, multiphase flow and subsea system. He holds BS and MS degrees, both in petroleum engineering from the University of Pune, India and Texas A&M University, respectively. Previously, he worked at Amec Paragon in Houston for four years as a flow assurance engineer. |
|
 |
GEORGE BONIN is a production superintendent with Petrobras over the Cottonwood GB 244 field. He joined Petrobras in January 2008 after being the liaison between Petrobras and Kerr McGee, the operator of the host platform, which GB 244 tied back all three Petrobras wells. During his 26-year career, Mr. Bonin was the lead operator for many of Kerr McGee’s offshore platforms. |
|
 |
PAULO WALTRICH is currently a PhD student and Research Assistant at Texas A&M University. He has been involved with research for more than ten years in the fields of fluid mechanics, heat transfer, multiphase flow and optimization of refrigeration systems. He has a BS and MSc in mechanical engineering from Federal University of Santa Catarina, Brazil. |
|
 |
DAVID JENNINGS is a senior development engineer in the Baker Hughes Applied Liquids Technology Group. Previously, Dr. Jennings spent eight years at Exxon working on a variety of upstream and downstream projects. He holds BS and PhD degrees in chemical engineering from Clemson University and Georgia Institute of Technology, respectively. |
|
 |
MICHAEL NEWBERRY is a technical advisor in the Baker Hughes Applied Liquids Technology Group. He has worked for Baker Hughes for more than 40 years in R&D, technical services and management for a wide range of upstream and downstream chemicals. He holds a BS in chemistry from Washington University in St. Louis and an MBA from the University of Missouri. |
|
 |
CLAUDIO ZIGLIO joined Petrobras in 2002, where he has been involved in research in the field of petroleum flow assurance and phase behavior. He is currently the manager of Flow Assurance and Artificial Lift at the Petrobras Research Center. He has a PhD in chemistry from Universidade de Campinas, Brazil (2000). |
|

