Hydrocarbon prospecting in deepwater Trinidad using AVO and spectral decomposition
Synthetic models for different fluid types and saturations indicate that fluid prediction is possible with these methods.
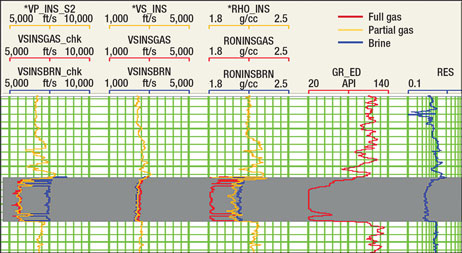
Synthetic models for different fluid types and saturations indicate that fluid prediction is possible with these methods.Mohamad Etemadi and Laszlo Benkovics, Repsol; Carlos Moreno, Maria A. Perez, Jeffrey S. Meyer and Alan Huffman, Fusion Petroleum Technologies Inc. The use of Amplitude Versus Offset (AVO) and Spectral Decomposition (SD) techniques for direct hydrocarbon identification in the Plio-Pleistocene section of deepwater areas near Trinidad and Tobago can help to better quantify risk during hydrocarbon prospecting. These seismic technologies require the use of pre-stack and post-stack seismic data that has been processed to preserve relative amplitude and frequency spectrum. To understand and predict the seismic response for different fluid types and lithologies, AVO and SD modeling based on existing well log information close to the study area was performed. The controlled synthetic models simulated the seismic response for wet sands, commercially saturated gas sands and partially saturated gas sands, as well as variations due to lithology. The fluid substitution was performed using Gassman’s equation after proper petrophysical analysis and invasion/dispersion corrections were done on the well data. PETROPHYSICS AND FLUID REPLACEMENT Invasion and dispersion corrections were applied to the well log data prior to fluid replacement. Fluid replacement was performed using Gassman’s equation to simulate the fluid and saturation effect on the well log response on the P-wave velocity, density and W-wave velocity due to the presence of brine, partially saturated and full gas sand cases. The resultant fluid replacement log responses are shown in Fig. 1. The effect of the fluid type and saturation changes the well log response. Track 1 shows Vp or P-wave velocity, Track 2 is Rhob or density, and Track 3 is Vs or S-wave velocity. In the first three tracks, red, yellow and blue colors represent log responses for full gas, partial gas sand and wet sand. The gamma ray is displayed in Track 4 and the in situ resistivity in Track 5. Notice that the in situ case is equivalent to the partial gas saturation case.
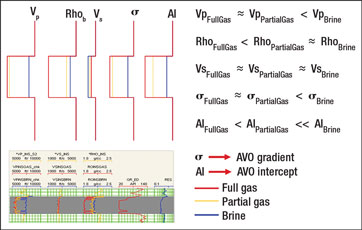
Figure 2 shows a sketch of the expected response for P-wave velocity, density, S-wave velocity, Poisson’s ratio (fourth track) and Acoustic Impedance (AI, fifth track) for the same fluid cases. The red, yellow and blue colors represent log response for full gas, partial gas sand and wet sand. The bottom part of Fig. 2 is an insertion of Fig. 1 that shows the data used to generate the sketch.
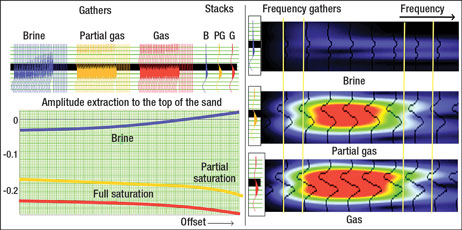
The differences in the petrophysical properties between wet sands, commercially saturated gas sands and partially saturated (noncommercial) gas sands indicate that it is possible to separate them under ideal circumstances. AVO AND SPECTRAL MODELING The fluid replacement results were used to generate synthetic seismic models. Analysis of the results indicated that hydrocarbon identification was possible and that the typical AVO and SD responses for hydrocarbons in sands close to or above tuning were Class III and Class IV. Figure 3 shows the AVO and SD synthetic seismic models for brine, partially saturated gas and full gas sand cases. The offset gathers were calculated using Zoeppritz’s equation. Angle stacks from 0° to 30° were calculated for each synthetic model. SD was performed on the stack sections using exponential pursuit decomposition, a variation of a matching pursuit technique. In Fig. 3, the amplitude extraction over the synthetic gathers shows the potential to differentiate hydrocarbon from brine using AVO. Very distinctive intercept and gradient amplitudes separate the brine case from the hydrocarbon cases. The separation between the partial gas case and the full gas case is relatively small in the conventional stack-and-gathers analysis. The spectral decomposition results observed in the synthetic frequency gathers also confirms that it is easy to separate brine from hydrocarbon and that there is important overlap between the spectral response of the partial gas and full gas cases. However, the synthetic models in Fig. 3 show a significant difference in the high-frequency part of the spectrum for the partial gas and full gas cases. The bandwidth of the full gas case is wider, and the high frequencies are also boosted in the full gas case. It is important to clarify that the thickness of the reservoir is the same for the synthetic models, and the only variable changing is the water/gas saturation. Even the velocities of the partial gas and full gas are similar, reducing the time/depth conversion difference between the full and partial gas cases. Analysis of the differences observed in the synthetic AVO and SD seismic modeling for wet sands, commercially saturated gas sands and partially saturated (noncommercial) gas sands indicated that it is possible to separate them under ideal circumstances.
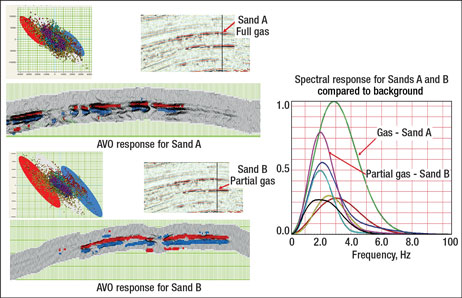
VALIDATION IN AREA WITH WELL CONTROL After modeling, validation of the techniques with real pre-stack and post-stack seismic data on calibration well locations was performed. Previously drilled amplitude anomalies were verified with AVO and SD, using the criteria learned during the modeling. It was concluded that some of the anomalies had the correct AVO and SD responses for hydrocarbon, but others had misleading AVO and SD responses that are more typical to lithological variation than to fluid effect. During the reevaluation of the previously drilled prospects, it was found that not all of the post-stack amplitude anomalies drilled had commercial hydrocarbon and several of them had amplitudes related to lithology. Very subtle differences in the AVO and SD responses were the only way to discriminate between hydrocarbon and lithology, which make the AVO and SD analyses more complex, and the inclusion of other criteria, such as pressure information and geological knowledge, may be required to discriminate between “good” hydrocarbon anomalies and “bad” ones. Figure 4 shows the AVO and SD analyses in two anomalies drilled by one of the calibration wells. AVO response in both cases indicated the presence of hydrocarbon; however, the spectral response for the fully saturated gas sand (Sand A) is distinct from that of the partially saturated sand (Sand B). The amplitude spectrum in the full gas case is wider and the high frequencies are boosted, while the partially saturated gas sand shows bright spectral amplitude but the width of the amplitude spectrum is comparable to the bandwidth of the background. The distinctive boosted high-frequency pattern for the fully saturated gas sand has also been observed in other basins, including the Gulf of Mexico; however, at this point, it is only a generalized observation and a detailed explanation of the phenomenon has not been reported. The phenomenon occurs right at the reflection associated with hydrocarbon, and it is very different from the well-documented attenuation phenomenon typically observed below gas reservoirs. The phenomenon observed is the opposite of attenuation since the gas produces a boost of the high frequencies instead of a decrease of the high frequencies (attenuation below a gas sand). Detailed analyses of AVO and SD in the calibration area helped to identify wet sands, commercially saturated gas sands and partially saturated (noncommercial) gas sands. The same SD pattern response that differentiated the full gas sand from the partial gas sand observed in the modeling was also observed in the two anomalies shown in Fig. 4. The pattern of higher and wider bandwidth of the frequency response for the full gas sand when compared to the partial gas sand has also been observed in other areas.
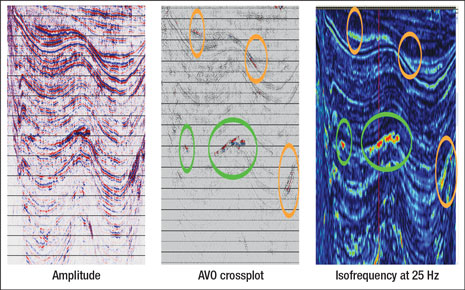
EXPLORATION RISK IN AN AREA WITHOUT WELL CONTROL After achieving a good understanding of the petrophysical properties and analysis in a calibrated area, seismic analysis supported with AVO and SD technologies was performed to risk assess prospects located in deepwater areas off Trinidad and Tobago. Many anomalies related to lithology were observed and discarded using the technique. The risking process gave less risk to the anomalies with similar AVO and SD to the fully saturated gas sand response modeled and validated in the area with wells. Mid-level risk was assigned to anomalies that only showed a good AVO response but with an SD response similar to the one observed in the partial saturation case that was modeled and validated. Higher risk was assigned to anomalies that had neither a positive AVO response nor a positive SD response for the full saturation gas case modeled and validated. Figure 5 shows a line with a series of amplitude anomalies observed in the conventional seismic. After detailed AVO and SD analyses, the main anomalies were ranked based on the AVO and SD signatures. The anomalies highlighted in yellow are considered high-risk anomalies and, in many cases, they show a positive AVO response but a poor SD response for hydrocarbon. The anomalies highlighted in green show less risk than the ones in orange because they not only show a good AVO response but also a good SD response for hydrocarbon. Geological criteria are also used while defining the risk of the anomalies.
It was also observed that many AVO and SD anomalies can be produced by lithology and can be interpreted incorrectly. AVO and SD analyses in the exploratory area helped to assess the risk of the different anomalies. Anomalies with modeled and validated AVO and SD responses for fully saturated gas sands were ranked higher than the anomalies with only AVO. Many anomalies with bright amplitude in the stack section were discarded because they had the wrong AVO response and SD response for hydrocarbon. CONCLUSIONS A methodology is proposed to evaluate exploratory areas using AVO and SD. Petrophysical analysis, fluid replacement, AVO and SD modeling, and validation in an area with well control were performed before detailed seismic analysis of the AVO and SD responses was done in the exploratory area. Petrophysical analysis and fluid substitution results demonstrated that very distinctive well log responses are observed for wet sand, partially saturated gas sands and fully saturated gas sands in the studied area. Petrophysically, it was predicted that hydrocarbon identification was possible. Synthetic AVO and SD models for different fluid types and saturations indicate that fluid prediction is possible with AVO and SD. The typical AVO response in the study area is expected to be Class III or IV. Discrimination of wet sands from gas-filled sands was possible with AVO and SD in the calibration area, and discrimination of fully saturated gas sands from partially saturated gas sands was possible with SD in the calibration area. In general, the bandwidth of an SD response for fully saturated sands is wider than for the wet and partially saturated sands; this helped to risk assess the existing AVO anomalies in a different way. In the exploratory area, lower risk was assigned to the anomalies with positive AVO and SD responses for hydrocarbon, mid-level risk was assigned to anomalies with only an AVO anomaly, and higher risk was assigned to the anomalies with negative AVO and SD responses. Geological risk was also included during the evaluation.
ACKNOWLEDGMENTS The authors would like to thank Repsol for permitting the use of the data for this article. Preparation of seismic data was done by Freddy Obregon of Fusion Petroleum Technologies Inc. Many thanks to John Castagna of the University of Houston for establishing the basis for seismic analysis of spectral decomposition. This article was adapted from OTC 19984 presented at the Offshore Technology Conference held in Houston, May 4–7, 2009. BIBLIOGRAPHY • Burnett, M., Castagna, J., Camargo, G., Chen, H., Sanchez, J., Santana, A. and E. Hernandez, “Synergistic porosity mapping in the upper cretaceous of the Chiapas region using spectral decomposition and neural network inversion,” expanded abstract 2571 presented at the 74th Annual International Meeting, SEG, Expanded Abstracts.
|
||||||||||||||||||||||||||||||||||||||||||
- X80 heavy wall pipe solutions for deep/ultra-deepwater field developments in mild sour environment (November 2023)
- Wellbore seal control and monitoring enhance deepwater MPD operations (October 2023)
- Novel approaches to deepwater steel catenary production riser life extension benefit ESG (September 2023)
- Advancing casing drilling to deepwater: Rethinking top hole well construction (August 2023)
- Regional Report: Guyana-Suriname (July 2023)
- Oil States’ Taylor sees pick-up in OFS business in deepwater and international sectors (June 2023)

