Reservoir management of gas fields using permanent sensors
NATURAL GAS
|
|||||||||||||||||||||||||||||||||||||||||||||||
 |
|
|
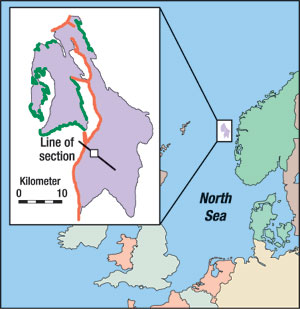
Gas production at the field began in 1991, with the Troll-to-Oseberg Gas Injection (TOGI), while the main sales takeout started in 1996. From Troll, gas is initially transported to the onshore facility in Norway, then through Zeepipe to Belgium, and finally via Statpipe / Norpipe to Germany. This major gas accumulation will supply a significant portion of gas demand in Western Europe for the next 50 years. Pressure depletion was selected as the gas-exploitation strategy.
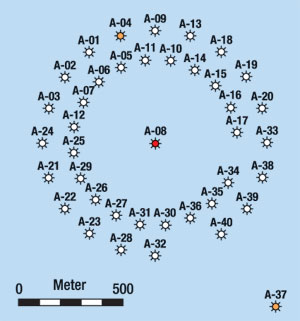
Fig. 2 shows a cross-section of Troll field. During 1997 – 99, 40 wells were drilled into the top of the field structure and completed in upper reservoir zones. The wells were drilled in two concentric circles, together acting as one "super well," with the potential for large gas takeouts between 40 and 120 MMcmd (1,400 and 4,200 MMcfd), Fig. 3.
 |
|
|
 |
|
|
Statoil and its license partners wanted to ensure high production rates without reducing overall recovery. Since all Troll wells had been drilled within two-three years, drilling operations were finished before significant production data was gathered. Consequently, one would have to rely on data gathered during production. To achieve sufficient high-quality data, observation Well A-08 was drilled in the center of the circular well pattern, Fig. 3.
It was felt that data from the observation well should help answer key questions regarding the selected drainage strategy, and help acquire information that could improve future development plans. Gas production from Troll is taking place in the upper parts of the reservoir, but it was desirable to identify rock properties and pressure changes farther down the gas column and in the aquifer zone. Such data would reveal information on, for example, water movement and eventual barriers to vertical communication. Lack of vertical fluid movement between reservoir layers would be an obstruction to gas flow, with potential reduction in total gas recovery. Therefore, the observation well was drilled through the entire reservoir column and into the water zone.
The operators also wanted to address the question of reservoir compaction. By combining radioactive markers with the pore-pressure monitoring system, the aim was to create a detailed model of compaction mechanisms and the ability to predict future effects.
Troll Field System
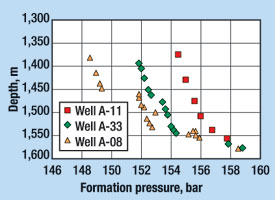
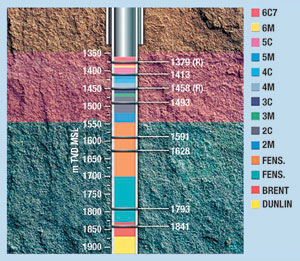
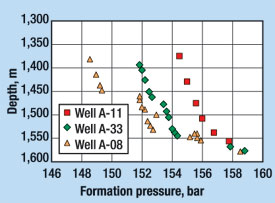
The approximately 600-m-thick Troll reservoir is fairly homogeneous throughout the gas and water zones, exhibiting high porosity with permeability in the Darcy range. A section of almost 500 m was chosen for investigation, and numerous geological layers are found within, Fig. 4. RFT-data from openhole surveys indicated partial pressure barriers, and at 1,450 m, a distinct shift was observed in some of the wells, Fig. 5.
 |
|
|
 |
|
|
It was important to reach understanding and verification of the production mechanism, and to be able to predict gas take-out rates for the lifetime of the field. This would eventually have great impact on factors like field subsidence, vertical pressure communication, topside facilities, major investments and future gas sales to the European Continent.
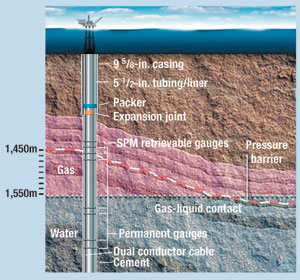
The A-08 observation well. Drilled during the winter of 1997-98, the observation well was completed through the entire reservoir and down into the water zone, with eight pressure gauges located in different zones to continuously monitor pore pressure. Six of the gauges were permanently cemented into the formation, whereas two were retrievable in side-pocket mandrels, Fig. 6. A monitoring system was installed at surface at Troll platform and in Statoil’s offices onshore, so that engineers could continuously monitor the pore pressure in real time.
 |
|
|
Pore-pressure gauges. The sensors used are standard high-resolution quartz gauges, with modifications made to face the formation directly when cemented in place.1,2 Two of the gauges were made as retrievable, replaceable tools.
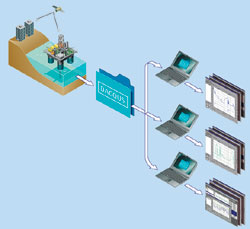
Surface monitoring system. All observation-well gauges feed their data directly into the surface data-acquisition and management system used by Statoil. Special data filtering software was developed to facilitate the monitoring program. The DACQUS software enables continuous monitoring from all of the observation gauges and from the two producers also equipped with permanent gauges, Fig. 7.1,2
 |
|
|
Installation of the downhole system. Pore-pressure changes are relatively subtle, so any measuring system would have to be placed as close to the formation as possible. The completion plan for the A-08 observation well called for positioning the gauges such that only a very thin layer of cement existed between gauge and formation.
The solution required close cooperation between Statoil, Roxar, Camco and Halliburton engineers. Halliburton supplied the low-permeability cement, expansion joint and packer for the observation well. Roxar designed a special gauge carrier to ensure good contact against the sandface and minimize the gap between sensor port and formation. The company also developed special ‘feed throughs’ and connectors that have been applied in numerous completions since the Troll installation. Camco built a modified version of their side-pocket mandrel to meet gauge placement and retrieval requirements.
Detailed running procedures were prepared between Statoil and the suppliers involved to ensure success and minimize exposure and risk. Deploying the observation well gauges was not straightforward: The assembly was lowered into the well and retrieved twice before it could be correctly set. Despite these difficulties, there were no equipment failures as the eight gauges were installed. To illustrate some of the complexity of the completion, five dual-conductor cables were used, and a total of about 40 electrical connections had to maintain their integrity throughout these extensive operations.
Subsequent to the A-08 installation, standard, permanent downhole-monitoring systems were installed in the gas producers A-04 and A-37, Fig. 3. This provided two additional real-time downhole-monitoring points. These proved to be highly valuable for verification of the gauge data in A-08.
Verification of pore-pressure data. It was important to verify the pressure values from the downhole gauges. Of concern was that the data would be corrupted due to vertical communication via cement breakdown in the observation well, or that the cement between formation and sensor would interfere with recording true reservoir pressures. Such verification was not straightforward and represented a challenge for the project.
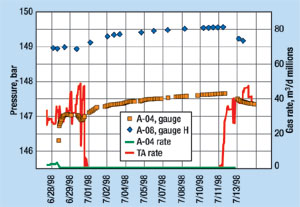
During a platform shutdown period in 1998, an opportunity for gauge verification emerged. During that period, pressure data was measured in A-04 (Fig. 3) using a permanent P/T gauge. Fig. 8 shows the data measured in A-04 compared to the data measured using the pore-pressure gauges in A-08. As can be seen, the two pressure responses to the shut-in are identical in shape, but have a constant difference throughout the shut-in period. This pressure difference is attributable to gauges placed at different well depths. As the pressure response is equal in A-04 and A-08, the authors concluded that the pore-pressure gauges in the observation well actually reflect the formation pressure changes. If there were limited cement integrity between the gauges in A-08, or if cement in front of the sensor prevented formation contact, the pressure response would not be the same as for A-04.
 |
|
|
Reservoir Management Using the A-08
This section describes how the pressure monitoring system has been used for reservoir management on Troll.
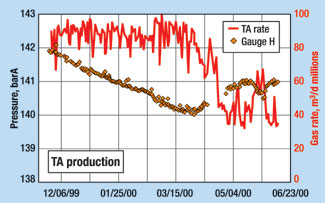
The "buffering effect." Whereas the pressure data answered some key questions that were asked before gauge installation, interesting new information also emerged, such as the so-called "buffering effect." During the winter, gas takeout at Troll is twice that in summer months. This dramatic change between winter and summer depletion rates sets up a large, slow moving pressure transient within the reservoir. More gas is flowing toward the "super well" than is produced from it, both from a distance and from deeper layers.
Pore-pressure gauges in the observation well identified these transients and indicated how pressure around the super well rises during the summer months, due to recharging of the nearby formation, Fig. 9. The solid line shows the gas takeout rate, and the dots indicate pore pressure. During the winter period (from about December to March), the production is high (about 80 MMcmd, or 2.8 Bcfd), and the pressure is decreasing as the reservoir is depleted. By late March, the takeout is reduced, and although one might expect a pressure drop in summer due to significant withdrawal rates, the pressure actually increases. The reason is the above-mentioned charging effect, where more gas is flowing into the well area than out of the reservoir.
 |
|
|
History matching and forecasting. History matching and reservoir simulation modeling vindicated the Statoil decision to produce from the upper zones. These results supported the field development concept of treating the reservoir as a "tank" with good vertical fluid communication. One barrier was identified at a depth of 1,450 m: probably a shale horizon with pressure changes abruptly across it in some Troll wells.
Effective history matching will also help Statoil plan the deployment of additional equipment, such as a booster station to maintain production rates. For a field such as this, a $400 – 500 million investment is indicated, with a significant build and test lead-time. Knowing exactly when the booster station will be needed, the operators can plan their expenditures and construction schedules and budget accordingly.
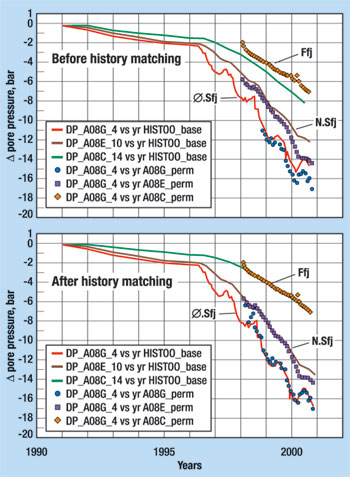
Fig. 10 shows how the gauge data are used for history matching. The pressure is simulated in three formations (Fensfjord, Upper Statfjord and Lower Sognefjord) at A-08 from 1990 through 2001. Before 1998, no gauge data were present, and before 1996, the pressure decline is due to the TOGI project. As can be seen from the upper figure, the simulated pressure response without using the pore-pressure gauge data, fails to match the observed pore-pressure data in all three formations, most severely in Fensfjord. A far better pressure decline match is obtained by including pore-pressure data in the history-matching procedure, as can be seen from the lower figure. Once calibrated using pore-pressure data, the model should be much better to forecast pressure decline and, thus, provide better estimates for the timing deployment of new equipment.
 |
|
|
Conclusions
From an environmental point of view, Troll field does not offer very harsh conditions. It is relatively shallow, and permanently installed gauges have been deployed in much tougher conditions than those encountered there. The main challenge, therefore, focused on the complexity of the completion string and installation work itself. Careful planning resulted in a successful installation of the gauges. Following five years of gas production from Troll field, pore-pressure gauges in the observation well have provided useful information to the operator.
After more than four years of continuous monitoring, the observation well has achieved all of its principal objectives. The gauges are still operating, and though not all of them reflect the true formation pressure, the installation has provided vital information about the field that could not have been gathered in any other way.
Changing pore pressure can reveal a great deal about a reservoir, helping to establish whether a proposed drainage strategy is the most effective development solution and highlighting problems for early remediation. By measuring these changes continuously, operators can assess how slight modifications in production rates, as well as major variations, such as fluctuations in seasonal takeout, will affect reservoir pressure and long-term performance.
Statoil’s decision to use pore-pressure variations to check the long-term health of this field gives some indication of how the technology could be applied in major oil and gas fields around the world. At Troll field, the observation well provides a passive check on field health and development. In other fields, particularly those entering maturity, these measurements could be combined with production or injection tools to control flow in specific zones for specific wells.
Shutdown data from neighboring wells have verified correct pore-pressure readings from the gauges, and these have identified and explained the seasonal buffering effect from large reservoir transients. The gauges have improved the understanding of vertical communication in and beneath the reservoir, and proven that the selected drainage strategy is both efficient and workable. Through history matching of field data, reservoir modeling and more accurate prediction has been facilitated. ![]()
Acknowledgment
The authors thank Statoil and the other Troll license partners for their permission and assistance to produce this article.
References
1 Bøe, A., J. E. Nordtvedt and H. S. Schmidt, "Integrated reservoir and production management: Solutions and field examples," SPE 65151, in Proceedings of the EUROPEC 2000, Paris, France, October 24 – 25, 2000.
2 Nygaard, O., C. Kramer, R. Kulkarni and J. E. Nordtvedt, "Development of a marginal gas condensate field using a novel integrated reservoir and production management approach," SPE 68734, in Proceedings of the APOGCE, Jakarta, Indonesia, April 17 – 19, 2001.
The authors |
|
Harald Schmidt earned an MSc from Colorado School of Mines and has a PE with 25 years in the oil industry, including Phillips, Smedvig and Roxar. He has worked with reservoir engineering and downhole instrumentation systems for permanent reservoir monitoring, worldwide marketing and sales. He currently works for Wellcon AS in Stavanger, Norway, a specialist consulting company. |
|
Ole Nygaard is petroleum engineering manager at DNO as. Det Norske Oljeselskap as) Norway. He previously worked 22 years for Statoil, mainly as the petroleum engineering manager for various field developments, like Gullfaks, Troll and Huldra. He served as chief reservoir engineer for Statoil for three years. He holds an MSc in petroleum engineering from Stavanger College, Norway. |
|
Stephen Erskine is a reservoir engineer at Statoil ASA in Bergen. He has 20 years of oil-industry experience in the North Sea area; including work at Core Laboratories and Exploration Logging. He holds a BSc in physical sciences from RGIT, Aberdeen, Scotland. |
|
- What's new in production (February 2024)
- U.S. operators reduce activity as crude prices plunge (February 2024)
- U.S. producing gas wells increase despite low prices (February 2024)
- U.S. oil and natural gas production hits record highs (February 2024)
- Dallas Fed: E&P activity essentially unchanged; optimism wanes as uncertainty jumps (January 2024)
- Mixed outlook for activity on the UK Continental Shelf (December 2023)

