OPEC petroleum production forecast revised down for 2021
In the August Short-Term Energy Outlook, the U.S. Energy Information Administration forecasts larger than previously expected world petroleum inventory draws in 2021 and larger inventory builds in 2022. The changes are driven mostly by forecast changes to production from OPEC and Russia as a result of the most recent OPEC+ agreement. Concerns about decreased demand because of increasing COVID-19 cases have recently driven crude oil prices down, which has offset some initial price increases due to larger inventory draws. As a result, the crude oil price forecast remains mostly unchanged from the July STEO. However, we have revised down our forecast for total world petroleum production.
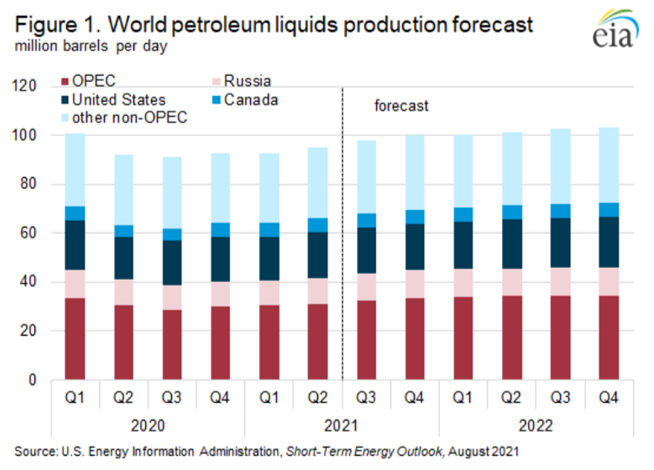
In the August STEO, EIA forecasts that total world petroleum production will average 98.9 million barrels per day (b/d) in the second half of 2021 (2H21), down from a forecast of 99.4 million b/d in the July STEO (Figure 1). The forecast decreased for world petroleum production in 2021 because of lower forecast production from OPEC, which is only slightly offset by increased forecast production in Russia. In 2022, EIA forecasts that global petroleum production will average 101.8 million b/d—20,000 b/d less than we forecast in the July STEO.
On July 18, OPEC+, which includes OPEC and several non-OPEC members (including Russia), agreed to increase monthly crude oil production starting in August 2021. In early July, members of OPEC+ adjourned without reaching a new crude oil production agreement. Negotiations stalled because of disagreements between Saudi Arabia and the United Arab Emirates on the baseline levels against which the members’ production cuts should be measured. In the deal announced on July 18, OPEC+ members agreed to increase production by 400,000 b/d each month starting in August 2021. This agreement is in addition to production increases that already took place through July 2021, including the full reversal of Saudi Arabia’s voluntary production cut of an additional 1 million b/d.
The latest agreement calls for the 400,000 b/d monthly increase to continue until the previous production cuts are fully reversed, which would occur by 3Q22 if implemented at that rate. However, OPEC+ extended the production agreement to include monthly meetings through the end of 2022 so that it can adjust production targets as necessary. The most recent agreement did not specify monthly output targets, which leaves exact implementation uncertain. OPEC+ also agreed to raise the baselines for Saudi Arabia, Russia, the UAE, Iraq, and Kuwait by a combined 1.6 million b/d starting in May 2022; however, they did not specify how they would implement the new baselines. Some countries, including Nigeria and Algeria, have requested that OPEC+ review their baselines as well.
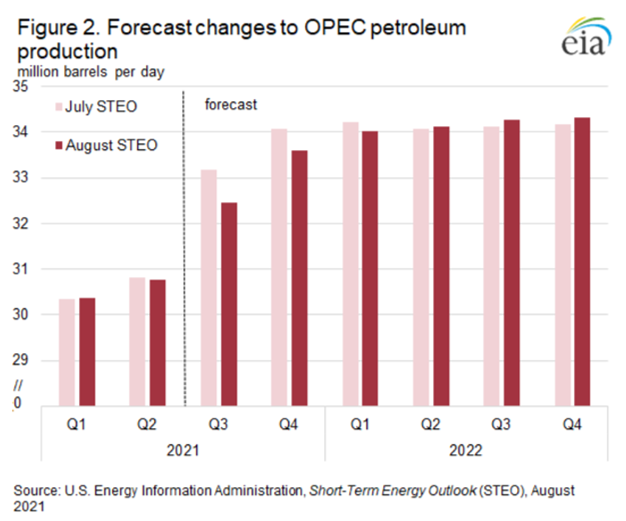
In the August STEO, EIA forecasts that OPEC total petroleum production will average 33.0 million b/d in 2H21, down 600,000 b/d from the July forecast for the same period (Figure 2). In the July STEO, it was expected that OPEC would raise production by more than the group ultimately agreed to in order to meet global demand. EIA now expects most OPEC countries will fully comply with the agreement during 2H21.
For Russia, petroleum production is expected to average 11.0 million b/d in 2H21, up from forecast production of 10.8 million b/d in the July STEO. We forecast that petroleum production in Russia will average 11.6 million b/d in 2022, up by 100,000 b/d compared with the July forecast. EIA expects that Russia will increase production significantly as its production targets increase.
The agency also revised its forecast for OPEC petroleum production in 2022 up by 40,000 b/d from the July STEO to average 34.2 million b/d. In 2022, EIA expects OPEC+ monthly production increases to total less than 400,000 b/d. This output growth is forecast to avoid oversupplying the markets and pushing down the price of crude oil. However, we expect that some countries will produce more as a result of their increased baselines starting in May 2022, including the UAE, Kuwait, and Iraq. The forecast assumes that existing sanctions against Iran will remain in place through the end of the forecast period. However, our forecast includes rising petroleum production from Iran over that period despite sanctions remaining in place, and we assume that OPEC will not adjust production levels to accommodate this increase.
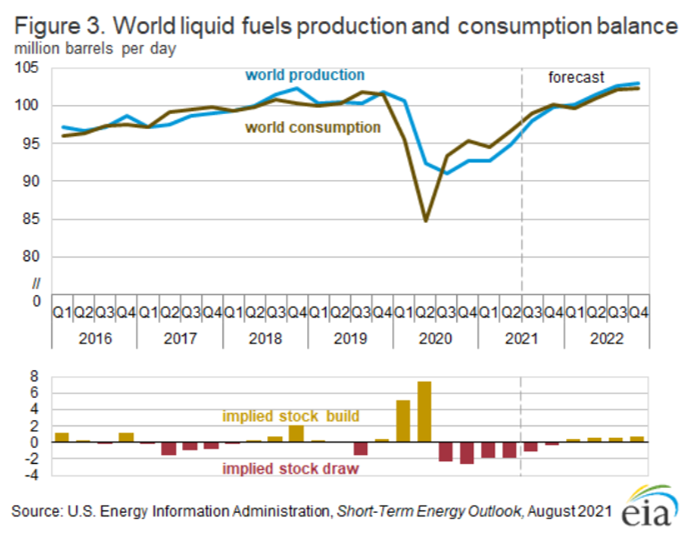
In the August STEO, EIA expects that global implied inventories (the difference between world consumption and production) will draw at an average rate of 1.0 million b/d in 3Q21 and slow to 310,000 b/d in 4Q21, averaging 670,000 b/d in 2H21 compared with inventory withdrawals of 210,000 b/d forecast in the July STEO for the same period. In the August STEO, it is anticipated that global inventory builds will average 550,000 b/d in 2022, up from a forecast of 460,000 b/d in the July STEO (Figure 3).
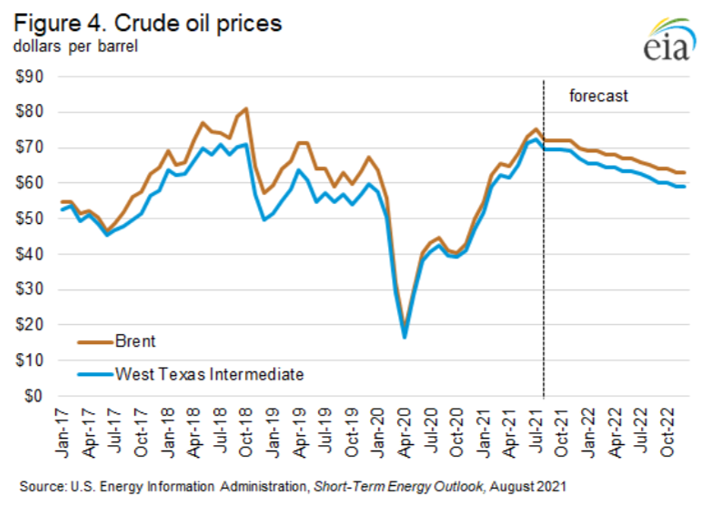
Recent crude oil price activity has been mixed in response to the OPEC+ supply agreement and renewed demand concerns, resulting in increased price volatility. Forecast prices for Brent and West Texas Intermediate (WTI) crude oil remains largely unchanged from the July STEO. In the August STEO, EIA expects that the price of Brent will fall less than $1 per barrel (b) in 2H21 compared with the July STEO, remaining at $72/b. The price of WTI is expected to increase by less than $1/b compared with the July STEO during the same period, remaining at $69/b. Forecast prices for Brent and WTI in 2022 were each revised down by nearly $1/b to average $66/b and $62/b, respectively (Figure 4).
U.S. average regular gasoline price increases, diesel price decreases
The U.S. average regular gasoline retail price increased more than 1 cent to $3.17 per gallon on August 9, $1.01 higher than the same time last year. The Rocky Mountain price increased more than 3 cents to $3.67 per gallon, the West Coast price increased more than 2 cents to $3.94 per gallon, the Midwest price increased nearly 2 cents to $3.06 per gallon, and the East Coast price increased more than 1 cent to $3.04 per gallon. The Gulf Coast price decreased nearly 1 cent to $2.83 per gallon.
The U.S. average diesel fuel price decreased less than 1 cent to $3.36 per gallon on August 9, 94 cents higher than a year ago. The Gulf Coast price decreased more than 1 cent to $3.08 per gallon, the Midwest price decreased nearly 1 cent to $3.27 per gallon, and the East Coast price decreased less than 1 cent, remaining virtually unchanged at $3.33 per gallon. The West Coast price increased nearly 2 cents to $4.01 per gallon, and the Rocky Mountain price increased nearly 1 cent to $3.68 per gallon.

