Ranking anti-agglomerant efficiency for gas hydrates through molecular dynamic simulations
Gas hydrates,1 or clathrates, are inclusion compounds that comprise water and low molecular weight molecules (termed guests) enclathrated in crystalline three-dimensional cages that the water molecules form around them by hydrogen bonding. Depending on the size of the guest and its interactions with the water, different crystal structures can form, the most well-known being sI, sII and sH, which differ in the type and ratio of cages.
Gas hydrates play a crucial role in the oil and gas industry, especially in deepwater environments where they can form spontaneously under common operational conditions, causing potentially catastrophic pipeline and equipment blockages. This importance has led to the development of low dosage additives2,3 that can either delay hydrate nucleation (kinetic hydrate inhibitors (KHI)) or prevent the agglomeration of formed hydrate particles (anti-agglomerants, AA). Compared to kinetic inhibitors, AAs have the advantage of being applicable in a larger sub-cooling range, shut-ins and are, therefore, better suited for deepwater applications.4
Although several commercial AA products exist, there is an increasing need to improve the understanding of the underlying mechanisms and to produce more efficient and environmentally-acceptable AAs. Computational approaches, such as atomistic simulations, can accelerate the discovery of new molecules, as they allow going beyond the traditional trial-and-error-based experimental methods.
In this study, atomistic simulations based on molecular dynamics (MD)5 were used to get direct insights into the fundamental processes of anti-agglomeration at a molecular level. This technique uses parametrized atomistic interactions, termed force fields, to simulate the real time evolution of system. We have examined four different AA molecules with clear differences in their chemistries, and focused on their collective behavior, namely whether a layer of AA molecules pre-assembled on the surfaces of a hydrate crystal and a water droplet could prevent the agglomeration between these two particles.
Moreover, we also tested the molecules in the laboratory concerning their hydrate anti-agglomeration potency, enabling a quantitative comparison of this experimentally-based ranking and the computational ranking obtained via the MD simulations. The goal was to assess the capability of computational methods to predict the anti-agglomeration behavior of different molecules, intending to serve as a basis for further and rapid in silico molecular innovation to create more sustainable and environmentally acceptable solutions.

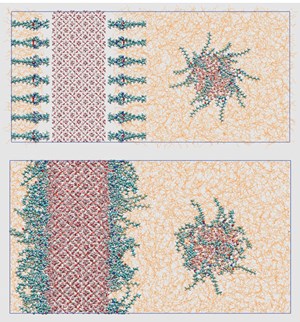
Computational methodology. The simulated system consisted of three main components: 1) a slab of sII methane-propane hydrate (dimensions 8.7 nm × 8.7 nm × 3.5 nm), with all small cages being filled with methane molecules and all large cages with propane molecules, and the surfaces on both sides being covered with the desired number of AA oriented perpendicular to the surface; 2) a water sphere of a 1.5 nm radius centered at a distance of 4.5 nm above the AA layer, also covered with a layer of AAs oriented perpendicular to the droplet surface; and 3) a hydrocarbon mixture (50 mol% dodecane, 4 mol% propane, 6 mol% ethane and 40 mol% methane) as solvent. Figure 1 shows a snapshot of the initial configuration for a particular system, along with a snapshot of the same system after its equilibration (100 ns), using MD at 277K and 100 bar. The basic idea behind the modeling approach was to study whether the surfactants are capable of inhibiting the agglomeration of the water droplet with the hydrate surface.
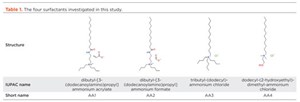
Four AA candidate molecules, shown in Table 1, were investigated. AA1 and AA2 are identical, except for the counterion; AA3 and AA4 have a simpler structure (no spacer group) but contain three alkyl substituent on the head group, instead of two, and a smaller counterion. AA4 has not been designed as a hydrate anti-agglomerant, but it was included, due to its structural similarity with the other AAs and to ensure that the study contains both well-performing and poorly performing molecules.
Since the anti-agglomeration potency of the surfactants presumably depends on their concentration, we studied three different coverages (on both the hydrate and the droplet) for each of the four AA molecules: low (0.65 molecules/nm2), medium (1.62 molecules/nm2) and high (2.62 molecules/nm2). This yields three setups for each AA, i.e. in total, there were 12 systems.
All simulations were carried out with the GROMACS MD simulation package (version 2018.3).9 The water molecules were described, using the TIP4P/ice model,6 the hydrocarbon molecules with TraPPE-UA7 and the inhibitors with GAFF.8 Temperature and pressure were maintained at 277K and 100 bar, respectively.
Before starting the production runs, all systems were equilibrated at the aforementioned conditions. Apart from providing a realistic description of the involved interfaces (e.g. formation of a small liquid water layer on the hydrate surface), this initial step allowed the AA molecules to arrange on their respective surfaces.
Experimental methodology. The experimental assessment of the four AA molecules was performed on a rocking cell unit. This approach, which is common practice for testing the performance of anti-agglomerant chemistry in the oil and gas industry,2 evaluates the molecules, based on their ability to effectively disperse small hydrate particles into the hydrocarbon phase. The results were classified as pass or fail, based on whether hydrate blockages were detected, and the performance of the AA was evaluated by determining the minimum effective dose (MED) required to register as a pass.
The rocking cell apparatus (rack) consists of a set of sapphire tubes, each assembled within a stainless steel support cage (hereby referred to as a rocking cell). Each tube (volume 20mL) was filled with 5 mL of dodecane and 5mL of 5% NaCl brine (watercut 50 vol.%), along with a stainless steel ball for mixing; the inhibitor was added as a 60 wt.% active solution at dose rates in percent, by volume of water (vol.%); and Green Canyon gas was used to pressurize the cells. The outer positions of the rack were moved up and down vertically (“rocks”), leading to a tilting of the rocking cells and causing the steel ball to move from one end of the cell to the other.
To determine the effectiveness of the various concentrations of anti-agglomerants, the following test procedure was executed:
- Saturation step: At a temperature of 49°C and a pressure of 138 bar (the latter will be kept constant throughout the test), the apparatus is set to rock at five rocks per minute for 2 hrs, to ensure that the fluids have been saturated with gas.
- Cooling step: The system is cooled from 49°C to 4°C over 6 hr, while maintaining a rocking rate of five rocks per min.
- Steady-state mixing step before shut-in: While keeping the temperature at 4°C, the apparatus is kept rocking at five rocks per min. for 12 hrs, to ensure complete hydrate formation.
- Shut-in step: The apparatus stops rocking, and the cell position is set to horizontal and kept at a constant temperature of 4°C for 12 hrs.
- Steady-state mixing step after shut-in: The apparatus is restarted at the rate of five rocks per min. at the constant temperature of 4°C for 4 hrs.
Visual observations during the shut-in period, correlated with an interpretation of the time required for the ball within the cell to travel between two magnetic sensors, allowed to classify an experiment as pass or fail. Each experiment was conducted in duplicate to confirm reproducibility.
RESULTS
Brute force simulations. The computational investigation started with non-steered MD simulations, i.e. the molecules of the systems could move freely according to the forces acting on them. For each of the 12 systems, an extended simulation (up to 600 ns) was performed, during which the water droplet was observed to diffuse freely inside the liquid hydrocarbon phase until it irreversibly coalesced with the hydrate surface. During coalescence, a capillary water bridge can be observed, especially at low surface concentrations. Coalescence is observed to proceed with the wetting of the hydrate surface and, given enough time, the water molecules of the droplet spread evenly on the hydrate surface. The average time that the droplet can freely diffuse until it coalesces depends on the type of the AA and the surface coverage. However, this is an inherently stochastic process, and the time required for coalescence can vary substantially, even for identical systems.
The results of the 12 runs are shown in Table 2. In the medium- and high-concentration scenarios, no coalescence was observed, i.e. all examined candidate chemicals can act as an AA at high surface concentrations. In the case of low concentrations, there were differences between the different AA molecules; for some AAs, coalescence did happen, while for others, it did not.
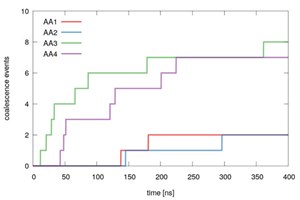
Evidently, this is the most interesting setup, and therefore ten independent runs for each AA were carried out. By counting how many times coalescence was observed, a ranking of the AAs could be obtained. As can be seen from Fig. 2, the results indicate that AA1 and AA2 were the best-performing molecules, as coalescence only took place 2 out of 10 times in the independent runs (2/10). Worse performance was obtained for AA4 (7/10), followed closely by AA3 (8/10).

Apart from such performance figures, the molecular simulations also permit additional insights into the behavior of the AAs at the interface. For instance, as an additional analysis, we determined the density profiles to get insights into the local arrangement of the surfactants on the hydrate surface. These density profiles reveal that methane is typically excluded from the AA film, with this effect being more pronounced as the surface concentration increases. Moreover, the distribution of the long tails gets more pronounced and is located farther away from the surface, the higher the coverage is, indicating more ordered films. Most interestingly, there are important differences between the long tail distributions between the AAs. For instance, the distribution for AA4 turned out to be much more pronounced, compared to AA3 at high densities, indicating a considerably stronger ordering.
Steered simulations. As has been seen, the agglomeration between the water droplet and the hydrate surface is a highly stochastic process, and several extended independent runs are required to extract significant information. The steered MD simulation can accelerate this process by actively pulling the water droplet toward the surface and forcing it to coalesce. Nevertheless, there is still some stochasticity, since the AA molecules are allowed to move freely. This is important, as interactions between the AAs on the hydrate surface and the droplet are fundamental for coalescence inhibition. Therefore, again focusing on the case of low AA concentration, ten independent steered runs (each one lasting 120 ns) were performed for each of the four AAs. While pulling the droplet toward the surface, the instantaneous force experienced by the droplet was determined, yielding the force-distance profile along the pulling direction.
If the hydrate surface and the water particle are far apart, there is no interaction between them, resulting in the force being zero. However, as the two particles get closer, the interaction between the AAs on their surfaces increases until it reaches a maximum. Once this repulsive barrier has been crossed, the water molecules come close enough to the hydrate surface, and the coalescence process starts. In order to discriminate between the four AAs, we integrated the force-distance profiles between two bounds covering the region of the barrier. The resulting integral represents the energy barrier created by the AAs that inhibits the agglomeration process.
The averaged results for the calculated energy barriers are shown in Table 3. Even though the standard deviations are rather large, there is a clear separation between AA1 and AA2 (11.6 kJ/mol and 10.8 kJ/mol, respectively), and AA3 and AA4 (3.5 kJ/mol and 1.8 kJ/mol, respectively). One can consequently draw the conclusion that AA1 and AA2 are better-suited to prevent agglomeration than AA3 and AA4. This is in excellent agreement with the ranking obtained from the non-steered simulations.
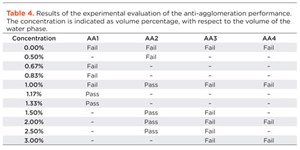
Experimental results. To characterize the performance of the four candidate AA molecules in the experimental rocking cell tests, the AA concentration was increased until the system showed no agglomeration. This yielded the MED that was required to prevent agglomeration, shown in Table 4. AA1 and AA2 are the best performers, with MEDs of 1.17% and 1.00%, respectively. AA3 and AA4, on the other hand, performed poorly and did not inhibit hydrate agglomeration even at the highest concentration tested (3.00%). Overall, the experimental results confirm the predictions made by the simulations: AA1 and AA2 are very similar and show good anti-agglomeration performance, whereas AA3 and AA4 are clearly worse.
CONCLUSION
The utility of four surfactant molecules as hydrate agglomeration inhibitors was assessed, using both computational (molecular dynamics) and experimental (rocking cell) methods. An excellent agreement between both approaches was observed, demonstrating that simulations have become mature enough to accurately predict the performance of such molecules. Moreover, the simulations performed at the atomistic level can provide many additional insights into the agglomeration process and the way in which the inhibitors prevent it that could not be obtained with a purely experimental approach.
Even though the simulations are not yet capable of yielding quantitative predictions (e.g. to directly calculate the MED) and are limited to qualitative statements, this does not belittle their utility. Relative comparisons between several molecules, in combination with a few quantitative experimental reference points, allows reasonable quantitative predictions.
Once such a reference framework has been set up, the possibility to perform systematic computational high-throughput screenings of many molecules, exploiting scalable computational resources, allows to implement an efficient funnel approach, where only the most promising candidates will eventually be synthesized and tested in the laboratory. This allows us to go beyond a purely experimental approach where one has to synthesize and test every molecule in the laboratory, making research more efficient and scalable.
ACKNOWLEDGEMENT
The authors thank Clariant for allowing this work to be published.
We also acknowledge PRACE for awarding us access to JUWELS at GCS@FZJ, Germany.
REFERENCES
- Sloan, E. D., and C. Koh, “Clathrate hydrates of natural gases,” CRC Press, 2007.
- Kelland, M. A., “History of the development of low-dosage hydrate inhibitors,” Energy & Fuels 20: 825–847, 2006.
- Perrin, A., O. Musa and J. Steed, “The chemistry of low-dosage clathrate hydrate inhibitors, 2013,” Chem. Soc. Rev. 42: 1996–2015.
- Guo, B., S. Song, A. Ghalambor and T. Lin, Offshore Pipelines, Chapter 15, Gulf Professional Publishing, 2013.
- Frenkel, D. and B. Smit, Understanding Molecular Simulation, 2nd ed. Academic Press, 2001.
- Abascal, J. L. F., E. Sanz, R. García Fernández and C. Vega, “Potential model for the study of ices and amorphous water,” TIP4P/Ice, The Journal of Chemical Physics, 122: 234511, 2005.
- Potoff, J. J., and J. Siepmann, “Vapor–liquid equilibria of mixtures containing alkanes, carbon dioxide, and nitrogen,” AIChE Journal 47: 1676–1682, 2001.
- Wang, J., R. Wolf, J. Caldwell, P. Kollman and D. Case, “Development and testing of a general amber force field,” Journal of Computational Chemistry 25: 1157–1174, 2004.
- Van Der Spoel, D., E. Lindahl, B. Hess, G. Groenhof, A. Mark and H. Berendsen, “GROMACS: Fast, flexible and free,” Journal of Computational Chemistry, 26: 1701–1718, 2005.
- What's new in production (February 2024)
- U.S. operators reduce activity as crude prices plunge (February 2024)
- U.S. producing gas wells increase despite low prices (February 2024)
- U.S. oil and natural gas production hits record highs (February 2024)
- Dallas Fed: E&P activity essentially unchanged; optimism wanes as uncertainty jumps (January 2024)
- Enhancing preparedness: The critical role of well control system surveys (December 2023)


