The future of India’s oil and gas production
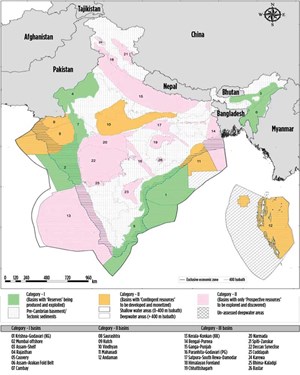
In 1995–1996, Oil and Natural Gas Corporation, India, assessed the prognosticated in-place petroleum resources in the country for 15 sedimentary basins (Fig. 1) and the deepwater offshore as 28,085 million metric tons of oil equivalent (MMtoe), or 206 Bboe. This was followed in 2017 by another assessment of a set of 15 sedimentary basins (Table 1) by DGH¹ in cooperation with a team of ONGC-OIL-DGH. For these 15 basins with adequate geological information, 3D Petroleum System Modeling (“PSM”) was adopted for assessing resources. For the remaining 13 basins, an aerial yield method was adopted.
During the 1995–1996 exercise, deepwater areas were not assigned to respective basins. Instead, a gross volume was put against deepwater areas between 200 m bathymetry and the EEZ limit. In the 2017 study, deepwater areas were redefined between 400 m bathymetry and the EEZ limit, and the same has been proportioned with respective basins falling into deep water.
Within Rajasthan, three geologically different basins (Bikaner-Nagaur, Jaisalmer and Barmer) have been compiled together by DGH; however, their petroleum resources are given separately for each basin by DGH² in its OALP document.
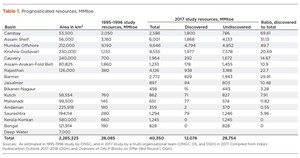
Using the PSM system of modeling, prognosticated resources were estimated for 15 basins as 40,350 MMtoe (295.8 Bboe), of which 12,076 MMtoe (88 Bboe) have been discovered and the remaining 29,976 MMtoe (219 Bboe) are as yet undiscovered (or YTF) resources, Table 1. Surprisingly, with a lesser number of basins, the petroleum resources increased from 28,085 MMtoe (206.8 Bboe) by a staggering 43.67%, to 40,350 MMtoe (295.8 Bboe), of which about 30% are discovered resources and 70% are undiscovered resources.
DGH reassessed prognosticated resources after a gap of more than 20 years, as new data sets became available, as well as new plays being discovered in recent years in Mesozoic and fractured basement. Further, the assessments were done at play and segment levels in each basin.
Despite the inherent limitations in the estimation of prognosticated resources, the total resources of a country, and the figures for discovered oil in relation to the amount of undiscovered resources in the country, are statistics with a huge significance. These resources help in planning the long-term energy policy for the country.
Despite the tremendous increase in prognosticated resources during 2017, the magnitude of discovered resources has lagged far behind. As regards the upside potential for undiscovered resources in India, prospects in most basins are bleak.
It is a fact that most of India’s major oil and gas fields were discovered by the 1990s, despite the rather primitive technology available at that time. A substantial number of small oil and gas fields were discovered in following years, when sophisticated exploration technology was deployed. The exceptions were the Krishna-Godavari and Barmer basins, where exploration in earnest was started in the late 1990s.
DISCOVERED AND UNDISCOVERED RESOURCES IN THE BASINS
Table 1 shows the prognosticated, discovered and undiscovered resources in million metric tons of oil equivalent, as reported in 1995–1996 and again in 2017.
It is significant to note that the undiscovered resources in almost all the basins—as assessed in 2017—exceed, by far, the reserves discovered in these basins. Viewed uncritically, it implies that huge quantities of oil remain to be discovered in these basins. This is despite the last six decades of exploration by ONGC and Oil India and, for the last three decades, additionally work by various Indian and international oil companies.
Table 1 also yields some interesting information. Of the four most-explored basins in India, the Cambay basin has been explored most efficiently. It has yielded about 70% of the prognosticated resources assessed in 2017, and 87% of resources assessed in 1995.
The Mumbai Offshore basin appears to have also been explored efficiently: the discovered resources equal the undiscovered ones, as per both the studies. Among the major producing basins, exploration in the Assam basin has been least successful; only 31% of the oil has been discovered, as per the 2017 study, and 58% as per the 1995 study.
Barmer basin was considered bereft of petroleum resources in 1995; however, after oil was discovered in its northern portion, its total resource was estimated to be 2,772 million tons, of which only 29% has been discovered. For all other basins, the picture is dismal. Discovered resources indicate that with the exception of the Mumbai Offshore and the Cambay basin, the majority of prognosticated resources in the other basins remains undiscovered.
The ratio of discovered oil to prognosticated oil, estimated in Table 1, is very diagnostic. If the four major producing basins—Mumbai Offshore, Cambay, Barmer and the Assam Shelf—are excluded from the reckoning, the average for the remaining 11 basins is a dismal 12.3—i.e. for each barrel discovered, over 8 bbl of undiscovered oil remain in the basin.
Another metric was used to corroborate this aspect. To quantify the richness of each basin, the areal density of petroleum resources was calculated for each basin, simply as the discovered resource/km².
A purview of discovered resource per km² shows that the density is highest in the Cambay Graben (excluding western and eastern marginal shelves) with 83.72 Kilo tons of oil per km² (Kt/km²) area, followed by Barmer basin (75.36), Mumbai Offshore (41.32), Krishna-Godavari (38.02) and Assam Shelf (33.36) and is at its lowest in Bengal and Andaman basins where there has been no discovery follow. It is followed by Bikaner-Nagaur basin (0.21), Saurashtra (0.99) and Kutch (1.48). The areal density of petroleum resource in the Cambay basin reduces to a low value of 33.64 Kt/km², if both the western and eastern marginal shelves are included.
The picture of undiscovered resource density is naturally quite different than that for discovered resources. The undiscovered resource density is highest in Barmer basin (176.63 Kt/km²) followed by Krishna-Godavari (145.73), Assam Shelf (78.80) and Mumbai Offshore (41.82).
Once again, by a different metric, one arrives at the same result: Despite 60 years of work by Indian and international companies, the majority of oil in the petroliferous basins remains undiscovered.
PRODUCTION PROFILE IN A FIELD/BASIN
A petroleum basin or province is a geologically defined region containing oil and gas fields. Once a field is discovered in a basin, a large number of wells are drilled to develop and produce it, depending on reserves, areal field size and techno-economic considerations. If a field is developed quickly and put on production, it usually shows a rapid rise, typically two to three years; a plateau, typically zero to a few years; and then a long decline, lasting 30 years or more years for the big fields, and less for some of the smaller ones.
However, the rates of production build-up, plateau period and decline depend on the number of development wells required and the rate at which the wells are drilled and brought onstream. If the development wells are drilled slowly, the build-up is slower, and the plateau lasts for longer periods.
In a prospective basin, with continued exploration, more and more fields are found; however, the large fields tend to be discovered early, in part because they occupy a larger area, with subsequent discoveries tending to be progressively smaller and requiring more effort to find. These fields are then progressively developed and put on production, depending on their size and location in the basin, oil and gas evacuation facilities and techno-economic considerations.
Because of the sequence of discovery in a basin, with larger fields being discovered first followed by smaller and smaller fields, the production cycle of a basin shows build-up of production to a peak level, maintenance of plateau level for a few years, followed by a slow decline. The production cycle in a basin also depends on the size distribution of the fields, their discovery sequence, and the production cycle of each field found and developed.
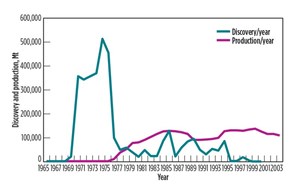
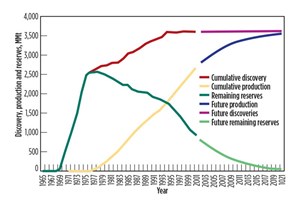
North Sea similarities. Morton³ analyzed UK North Sea production. Figure 2 shows a comparison of discovered oil and oil produced, while Fig. 3 shows discovery-production-reserves in the North Sea. Oil was found in the North Sea during 1965, and production started in 1967, but at a low rate until the discovery of 175-MMbbl Arbroath and 380-MMbbl Galleon fields in 1969.
In the following years, giant fields like Forties, Brent, Beryl, Piper and Ninian were discovered. In 1977, platforms were set, and pipelines were built. North Sea production took off in the late 1970s and increased until the mid-1980s, remaining at the same level up to 1990. It peaked in 1998 and since then has been in decline.
Based on his analysis, Morton observed that:
- In the North Sea since 1979, there have been only two years in which the E&P industry found more oil than it produced.
- Since it is absolutely impossible to produce more than one has discovered, the area under the discovery curve and the production curve must be equal.
- If oil reserves are not added at a rate greater than the oil produced, oil production declines at a rapid rate.
- Most of the main fields and reserves are discovered in the first years of exploration.
- The number and size of fields discovered decrease with time. There comes a time when fields discovered are insufficient to maintain production.
The production cycle for the North Sea basin is considered to exemplify a typical production cycle for basins. In the following section, the authors compare the production cycles of the North Sea with those for Cambay, Assam, Bombay Offshore, Barmer and Eastern Offshore (Cauvery and Krishna-Godavari) basins.
Production cycle of Indian basins. The basins under consideration have production cycles quite similar to other producing basins; however, if they are fundamentally different from the norm for other producing basins, they need to be analyzed for the differences. It would have been useful to have evaluated the production cycles of various fields in Indian basins, but this could not be done, due to non-availability of data in the public domain.
Oil production data from various states (but not from various basins) of India are available in the Indian Petroleum & Natural Gas Statistics, published by the Economics and Statistics Division of the Ministry of Petroleum and Natural Gas⁴. Assuming that oil and gas production for each basin is for the state in which it lies (Cambay basin in Gujarat; Barmer basin in Rajasthan; Krishna-Godavari basin in Andhra Pradesh; Cauvery basin in Tamil Nadu), output data are compiled for the 2002–2017 period, Tables 2 and 3.
Data for years 2002–2010 were obtained from the Annual Report for 2010–2011, whereas the data for years 2011–2017 were obtained from the Annual Report for 2017–2018 of the Ministry. Production data prior to 2002 are probably in the public domain but could not be located despite various attempts.
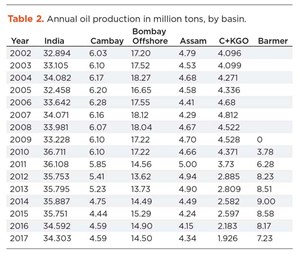
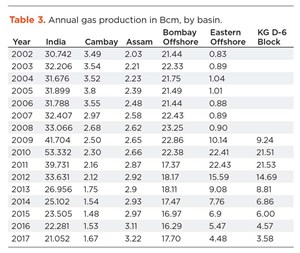
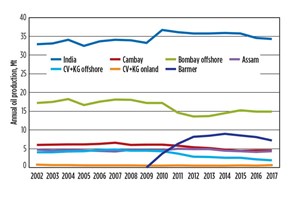
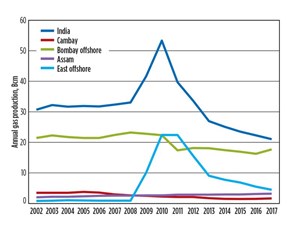
Table 2 and Fig. 4 show annual oil production, and Table 3 and Fig. 5 show annual gas output data for India, Cambay (Gujarat), Bombay Offshore, Assam, Cauvery and Krishna-Godavari (on land and offshore), and Barmer basins.
Annual oil production for India averaged 33–34 million tons per annum (242–249 Bbbl per annum) from 2002 to 2009 and increased to 36.11 million tons (265 Bbbl per annum) in 2010 and 2011, due to production from Barmer basin. It then declined to 34.3 million tons (251 Bbbl per annum) in 2017.
The sharp increase in India’s gas production, beginning in 2009, was due to commencement of output from the D1/D3 fields in Krishna-Godavari offshore, reaching a peak of 53.33 Bcm/year (1.883 Tcf/year) in 2010 and then declining to 21.05 Bcm/year (680 Bcf/year) in 2017.
In Cambay basin, production of oil and gas began with the discovery and development of Ankleshvar field. Oil and gas output were ramped up and maintained by the discovery and development of Kalol, Nawagam, North Kadi, Balol-Lanwa-Santhal and Gandhar fields in the years that followed. Since the discovery of Gandhar in 1982, there has been no significant discovery, but the level of oil and gas production was maintained by the discoveries of a large number of small fields.
In recent years, the discoveries of small fields have not been enough to maintain peak levels, resulting in declining oil production. Crude output in Cambay basin built up from 1961 to 1989 and was maintained at a level of about 6 MMt/year (44 MMbbl/year) up to 2010. Since then, it has been in a decline phase, falling to 4.6 MMt/year (34 MMbbl/year) in 2017. In Cambay basin, gas production commenced in 1971, producing 0.465 Bcm/year (15.9 Bcf/year) and increasing to 3.11 Bcm/year (110 Bcf/year) in 1997 and to 3.80 Bcm/year (134 Bcf/year) in 2005. From that point forward output has declined, reducing to 1.67 Bcm/year (59 Bcf/year) in 2017. Annual oil and gas production data for the years 1961 to 2002 is from Chowdhary (2004).⁵
In Assam, production of oil and gas began with the discovery of Naharkotiya field and was ramped up and maintained by the discovery and development of Rudrasagar, Lakwa-Lakhmani, Geleki field, plus several small fields in the years that followed. There has been no significant oil discovery in the last four decades, except the discovery of the Dikom group of fields. This was not sufficient to sustain production at plateau levels, resulting in a steady decline in oil production.
At Assam, oil production varied between 4.5 MMt/year and 4.7 MMt/year (33–34.5 MMbbl/year) from 2002 to 2010, except in 2007, when oil production reduced to a low of about 4.3 MMt/year (31.5 MMbbl/year). Oil production peaked to 5 MMt/year in 2011 but has declined since then. In Assam basin, gas production increased gradually from 2.03 Bcm/year (72 Bcf/year) in 2002 to 3.22 Bcm/year (114 Bcf/year) in 2017, the only basin showing an increasing trend.
Production of oil in the Bombay Offshore basin began with the discovery of Bombay High field and was maintained by the discovery and development of Bassein, Heera, Panna, Neelam, Mukta, Ratna, South Tapti and Mid Tapti fields, as well as by several small fields in the years that followed. There has been no significant oil discovery in the last four decades, and thus peak production was not sustained, resulting in a steady decline in produced oil, starting with the year 2011.
Oil production averaged between 17 and 18 MMt/year (125–132 MMbbl/year) from 2002 to 2010, and then it declined to 13.62 MMt/year (100 MMbbl/year) in 2013. It then increased to about 15 MMt/year (110 MMbbl/year) from 2015 to 2017. In the Bombay Offshore basin, production of gas increased from 21.44 Bcm/year (757 Bcf/year) to 23.25 Bcm/year (821 Bcf/year) in 2008. Since then, gas output generally has been in a decline phase, averaging 16.29 Bcm/year (575 Bcf/year) in 2016. However, gas production increased again, to 17.70 Bcm/year (625 Bcf/year) in 2017
Production of oil onshore in the Cauvery and Krishna-Godavari basins ranges between 0.4 and 0.66 MMt/year (3.0–4.8 MMbbl/year)) from 2002 to 2017, whereas oil production from Cauvery and Krishna-Godavari offshore increased from 4.09 MMt/year (30 MMbbl/year) in 2002 to 4.81 MMt/year (30 MMbbl/year) in 2007. Since then, this output has declined, averaging just 1.93 MMt/year (14 MMbbl/year) in 2017.
Gas production in the Eastern Offshore averaged between 0.83 Bcm/year (28 Bcf/year) and 0.97 Bcm/year (34 Bcf/year) in 2002-2008, and it is assumed that gas output continued to be at the same level from 2009 to 2017. Gas production increased in 2009, as the D1/D3 field in the KG-DWN-98/1 Block was put on production, producing 9.24 Bcm/year (326 Bcf/year) of gas. Production then increased, reaching a peak of 21.53 Bcm/year (760 Bcf/year) in 2011 before again declining, due to water ingress and water cut, reaching a low of 4.48 Bcm/year (158 Bcf/year) in 2017.
Production of oil in the Barmer basin began in 2010, with the discovery and development of Mangla, Bhagyam and Ashwariya fields. Production was about 3.7 MMt/year (27 MMbbl/year) in 2010 and increased to a maximum of 8.99 MMt/year (66 MMbbl/year) in 2014. Since then, output has been in decline, reducing to 7.23 MMt/year (53 MMbbl/year) in 2017.
A review of the oil and gas production profiles in almost all the basins clearly shows declining trends. As such, the excessive and humongous undiscovered resources in the Indian basins must not be, and cannot be, ascribed to anomalous production cycles.
CONCLUSIONS
Given acceptance of the dramatic increase in the prognosticated resources between 1995 and 2017, it becomes moot to question why a corresponding increase in the discovered resources is not observed. The obvious reasons could be that the undiscovered resources occur in subtle, hard-to-locate traps requiring specialized data acquisition and analysis techniques for locating subtle traps. Or, it could be that the basins have not been adequately explored, and the financial investment has been inadequate.
The fact that production in almost all the fields and basins is in a decline phase, while reserve growth and discoveries have decreased, suggests that a more restrained and conservative approach is called for, to achieve a realistic prognostication of resources.
REFERENCES
- Directorate General of Hydrocarbons, India. “India’s Hydrocarbon Outlook.” (http://dghindia.gov.in/assets/downloads/ar/2017–18.pdf)
- Directorate General of Hydrocarbons, India. “DGH Overview of OALP Block Offer Bid Round 1.” (https://online.dghindia.org/oalp/Downloads).
- Morton, G. R.,” An Analysis of the UK North Sea Production.” (http::/home.entouch.net/dmd.northsea.htm) (Open access).
- Economics and Statistics Division of the Ministry of Petroleum and Natural Gas, “Indian Petroleum & Natural Gas Statistics.” (http://www.petroleum.nic.in/more/indian-png-statistics).
- Chowdhary, L.R., 2004. “Petroleum Geology of the Cambay Basin, Gujarat, India.” Indian Petroleum Publishers, Dehradun, India. p. 1–171.
- Advancing offshore decarbonization through electrification of FPSOs (March 2024)
- Management issues- Dallas Fed: Activity sees modest growth; outlook improves, but cost increases continue (October 2023)
- What's new in production (October 2023)
- FPSO technology: Accelerating FPSO performance evolution (September 2023)
- A step-change in chemical injection (August 2023)
- Industry at a glance (June 2023)

