Shale producibility index helps operators determine best zone for landing horizontal section
A primary reason that vertical pilot wells are logged in tight oil plays is to determine the reservoir quality, and then use these data to pick the optimal lateral landing interval. The reservoir quality measured needs to reflect the production capability of the fractured and completed horizontal wells. The recently introduced metric, reservoir producibility index (RPI), takes the positive and negative aspects of the different fractions of the total organic carbon (TOC) in determining this quantity.
The kerogen and bitumen are two components of the TOC that are considered as negative reservoir quality indicators. Kerogen is a solid hydrocarbon that is insoluble in organic solvents, while bitumen is a highly viscous hydrocarbon that is soluble in organic solvents. As neither of these components are producible, they also impede the production of lighter oil by either absorbing the lighter hydrocarbons, or clogging the pore network. As such, these components were assigned as negative reservoir quality metrics.
The light oil, which is the fluid target for production, does exist in organic kerogen pores, where it is adsorbed or free in an oil-wetting, organic porous environment. The light oil also may exist in a potentially more mobile state, within the larger-sized, mixed-wetting inorganic porosity. The latter case is preferable, from an ease-of production standpoint.
The other pore fluid to consider in tight oil reservoirs is water, which can be either bound to the clays or exist in the mixed wet inorganic porosity. The production of water is something that generally needs to be avoided by circumventing completion in zones with high, mobile water content in the mixed wet pores. RPI is defined as:

Where WC_oil represents the mass fraction of light oil-based carbon per mass of formation, and WC_org represents the total organic carbon content, expressed as the mass fraction from all forms of organic carbon (i.e. kerogen plus bitumen plus oil) per mass of formation. The first term in the RPI (i.e WC_oil /WC_org) captures the positive RQ of light oil and the negative RQ of kerogen and bitumen. The squaring of the WC_oil term in the numerator of the RPI accounts for the richness of the producible hydrocarbon.
METHODS
The separation of the TOC components into kerogen, bitumen and oil is challenging downhole. Additionally, the presence of bound and free water phases also can cause additional challenges. A technique that has demonstrated promise for the identification of these different fluid components is nuclear magnetic resonance (NMR) based T1–T2 logging.
Nuclear magnetic resonance T1–T2 measurements are sensitive to the molecular motions of the hydrogens in the different fractions of the organic carbon and water. They can, therefore, be potentially separated in the 2D maps of T1–T2. The organic kerogen, which is a solid component has very short transverse relaxation times (T2) and is therefore not seen by downhole logging tools. Both, viscous bitumen and clay bound water have short transverse relaxation times.

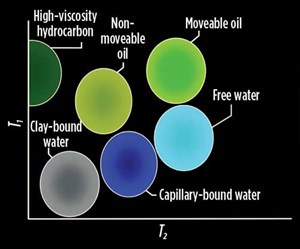
However, they can be potentially differentiated, because the viscous bitumen has a higher T1/T2 ratio in comparison to the clay associated water, which also has short transverse relaxation times but lower T1/T2 ratios. The light oil in organic versus inorganic porosities also could have distinct signatures in the 2D T1–T2 maps, and so does the free water in the mixed wet pores, in comparison to the other components. Due to these characteristics, the 2D NMR T1–T2 maps have proven useful in tight oil plays for fluid typing, Fig. 1.
T1–T2 maps from downhole NMR logging tools show unique signatures for hydrocarbons, such as gas, bitumen, and producible and bound oil. Similarly, capillary and clay-bound water and water in larger pores have different signatures. These signatures depend on many factors: properties of the fluids (composition, viscosity), properties of the rock (pore geometry), and the geometrical configuration and interaction of fluid phases within the pore space. Unless the fluids have very distinct and non-overlapping signatures in the T1–T2 domain, it can be challenging to visually separate the contribution from each of the different fluids and estimate fluid volumes from T1–T2 maps. This is especially true for downhole tools with lower signal-to-noise ratios in comparison to the laboratory measurements.
Recently, this problem has been addressed by an automated, unsupervised learning algorithm, based on non-negative matrix factorization (NMF), wherein the NMR T1–T2 maps corresponding to a specific rock type are factorized into two matrices: the first matrix contains the T1–T2 signatures of the different fluids, and the second contains the corresponding volumes. The NMF problem formulation is ill-conditioned, and the authors use multiple methods to stabilize the problem, including hierarchical clustering, as well as taking advantage of smoothness of the NMR signatures of the fluids in the T1–T2 domain.
There are a few key advantages of this unsupervised learning method. First, it does not require predetermined cut-offs in the T1–T2 domain to distinguish fluids. Second, simulations show that the method does not require a wide variation in fluid volumes at different depths. This allows the petrophysicist to pick a relatively short depth interval, consisting of one rock type to study T1–T2 map variations that should reflect sole variations in fluid properties. Last, it provides a metric to help guide the analyst in selecting the optimal number of fluids in the underlying dataset. This method has been shown to work well on simulated data sets, as well as field data sets from the Eagle Ford shale and the Permian basin.
In organic shale reservoirs, TOC is one of the most important factors in formation evaluation. There are a few methods available to compute TOC from logs, including Schmoker, delta log R and uranium content. These methods are empirical and need calibration from external information or core data. Geochemical logs, using capture and inelastic elemental spectroscopy, were shown to provide a direct TOC measurement. The measured TOC includes all sources of organic carbon, including kerogen, bitumen and light oil. The potentially producible light oil is of the most interest and needs to be distinguished from the other TOC components, which are negative RQ indicators, as described by RPI.
The elemental spectroscopy measurement also can provide mineralogy of the formation. Formation evaluation is performed using TOC, dry weights of individual minerals or elements, and fluid porosities from NMR T1–T2 logs as inputs. The result, with the inputs from inelastic capture spectroscopy and magnetic resonance logs, gives a more consistent, accurate estimation of mineralogy, porosity, saturation and permeability. In RPI calculation, WC_org can be calculated, using TOC from elemental spectroscopy. And WC_oil is calculated, using light oil porosity directly from NMR T1–T2 clustering results.
RESULTS AND DISCUSSION

We demonstrate the determination of the RPI from a well in the Eagle Ford shale. The logs that were run were the magnetic resonance logs providing the 2D T1–T2 maps, the inelastic capture spectroscopy and the triple combo logs, consisting of gamma ray, resistivity, density and nuclear measurements.
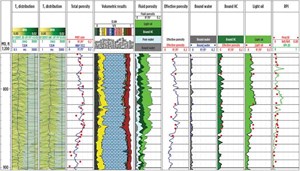
The 1D projections of the T1 and T2 distributions are shown in Fig. 2, in tracks 2 and 3, respectively. The porosity determined from the magnetic resonance logs is favorably compared to that measured on the core samples after retrieval, as shown in track 4. Core samples were analyzed, using the retort method to get fluid porosities. Based on the temperature at which the water or oil has been released from the core sample, fluid in the core sample can be classified as different fluid types. The volumes of the released fluids are measured over three different temperature ranges: T1 (75° to 250° F), T2 (250° to 600° F), and T3 (600° to 1,300° F). The water released in T1 is labeled free water or pore water. The water produced in T2 is labeled as clay-bound water. Oil produced during T2 is labeled as light oil. Hydrocarbon produced during T3 is labeled as bitumen or bound hydrocarbon. Core total porosity is defined as the sum of the above pore fluids from retort method, plus gas-filled porosity. Core effective porosity is defined as core total porosity less the clay-bound water porosity.
In tracks 5 and 6 a complete volumetric interpretative analysis of the matrix components and the fluid components is carried out. The mineralogy was calculated using dry weights of element from inelastic capture spectroscopy measurements. The fluid types and porosities were identified and quantified, using unsupervised clustering of magnetic resonance T1–T2 logs. In tracks 7-10, different porosities from the clustering results of the magnetic resonance log are displayed in comparison to those from core data.
In the final track, the RPI values are shown. It can be seen that there is significant variation of the RPI through the well depths. The values of the RPI have been favorably compared to the producible oil fraction determined from the core retrieval process. The producible oil of the core was quantified by measuring the expelled oil of the core from downhole condition to surface condition.

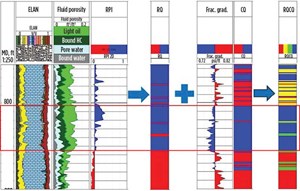
In Fig. 3, the RPI values are shown in track 4, with a cutoff used to qualitatively assign high and low RQ zones. With this reference/cutoff line of RPI, the logging interval can be classified as relatively high RQ zones with RPI values higher than the chosen cutoff (in blue shading) and relatively low RQ zones with RPI values lower than the cutoff (in red shading), as shown in track 5.
The RQ can be combined with other completion quality (CQ) metrics determined from acoustic or geomechanics data. Track 6 shows the hydraulic fracture pressure gradient contrast. The completion quality (CQ) is determined, using a cutoff of fracture pressure gradient, with good quality in blue color and bad quality in red color, as shown in track 7. The overall quality of the reservoir is determined qualitatively, with both RQ and CQ using the rule: a) both good qualities give good overall quality (in blue); b) both bad qualities give bad overall quality (in red); c) good CQ and bad RQ (in green); and d) good RQ and bad CQ (in yellow).
In the final track, the combination of the RQ from RPI, and the CQ from the acoustic logs, is shown. This final track can be a good indicator of the zone to land the lateral, as it takes into account both RQ and CQ of the well. Interval X800-X850 ft has good overall quality with high RPI, little free water and low fracture pressure gradient, which is a good zone recommended for landing laterals.
CONCLUSIONS
Our work has demonstrated a methodology to determine the RPI, which reflects the reservoir quality in unconventional tight oil plays, using a combination of 2D T1–T2 magnetic resonance logs in combination with inelastic capture spectroscopy logs. The measurement of the light oil quality and the TOC are the two inputs for RPI measured from the magnetic resonance and spectroscopy logs, respectively.
In combination with completion quality measurements, the RPI can be used to determine the best zones to land horizontal wells. A field trial has demonstrated, in an Eagle Ford well, how the RPI correlates with the produced oil fraction from core measurements.
ACKNOWLEDGEMENT
This article contains elements from SPWLA paper DOI: 10.30632, presented at the 60th Annual Logging Symposium, held in The Woodlands, Texas, June 17–19, 2019.
- Shale technology: Bayesian variable pressure decline-curve analysis for shale gas wells (March 2024)
- When electric meets intelligence: Powering a new era in hydraulic fracturing (January 2024)
- Next-generation electric fracturing system improves efficiency, ESG performance (January 2024)
- What's new in production (August 2023)
- Mobile electric microgrids address power demands of high-intensity fracing (July 2023)
- Organic acids offer an alternative acidizing practice for production optimization (June 2023)


