U.S. set for measured increase despite DUC build-up
Over the last 12 months, the global upstream industry has featured rising oil and gas production; volatile, unpredictable oil prices, as evidenced in the last three months; and in the U.S., slowly-but-steadily rising drilling activity. It remains to be seen, just how much impact the substantial drop in oil prices between late October and the beginning of January will have on operators’ capital budgets. We also have detected a growing case of “haves” and “have nots,” in the U.S., whereby those states with a significant shale presence are doing better than those states with more conventional activity. The Permian basin remains the “big-dog,” dominating the U.S. market and accounting for 27% of all drilling during 2018.
We had expected growth in Permian-area activity to slow to 4.8% during second-half 2018, and the reality has come close to our forecast. During first-half 2018, the Permian rig count grew 18.8%, and then just 4.2% in the second half. We remain concerned about what appears to be an irresponsible piling up of drilled-but-uncompleted wells (DUCs) in the Permian, and, for that matter, across all U.S. shale plays. Meanwhile, the U.S. Gulf of Mexico finally appears to be recovering, albeit very slowly.
The aforementioned factors, along with World Oil’s surveys of operators and state agencies, have all shaped this cycle’s U.S. forecasting process. Accordingly, World Oil’s editorial staff presents its 2019 E&P forecast, as follows:
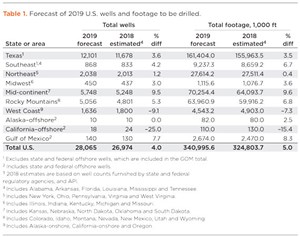
- U.S. drilling will increase 4.0%, to 28,065 wells, Table 1
- U.S. footage will gain 5.0%, to 341.0 MMft of hole
- U.S. Gulf of Mexico should improve 7.7%, to 140 wells.
Forecasting accuracy. For 2018, World Oil’s original forecast early last year called for a 12.0% gain in wells drilled to 27,095. And, by latest best estimates, actual activity grew 11.99%, to 26,974 wells. The difference between that figure and our original forecast is only 121 wells, or 0.4%. And our independent estimate of 2018’s Texas activity is only 94 wells greater than what the RRC published, a difference of just 0.8%.
U.S. MARKET FACTORS
During the past year, the U.S. E&P industry continued to recover, adding to the gains realized in 2017. The ability and willingness of OPEC+ to orchestrate production cuts, to stabilize crude markets, was significant in helping U.S. oil producers eke out a profit. However, after remaining relatively stable throughout the year, WTI plunged to just $42.53 on Dec. 24. But thanks mainly to production cuts by OPEC+, crude prices have recovered more than 20% since hitting December’s two-year low. Mergers and acquisitions also played an important role in helping U.S. operators remain profitable. During 2018, several companies acquired assets at attractive valuations, while selling underperforming non-core properties that could have impacted profitability negatively.
As the rig count continued to expand, demand for oilfield services also increased, helping the sector recover from brutal price cuts required by operators to survive the 2016 downturn. As such, the break-even cost in most shale plays rose, as OFS companies increased prices on equipment, crews and raw materials. The increased costs and lack of equipment hampered the sector’s ability to complete wells. The slowdown caused an alarming build-up of drilled-but-uncompleted wells (DUCs).
The increased activity caused production to grow during second-half 2018 and, in November, crude output reached 11.58 MMbopd. The booming shale plays have made the U.S. the world’s largest petroleum producer, surpassing Russia and Saudi Arabia, turning the country into a net oil exporter for the first time in 75 years. Although drilling is increasing throughout much of the U.S., operators will remain focused on the Permian and oil-rich portions of the SCOOP/ STACK plays in Oklahoma as the most rewarding areas to exploit.
Capex. Drilling activity was stimulated by rising oil prices, as operators increased capex in 2018 to capitalize on the opportunity, according to James West, chief analyst at the Evercore investment firm. But despite a promising start in 2018, Evercore expects the industry to pull back on drilling activity through the first half of 2019 because of short-term uncertainty and volatile oil prices. But an expansion should take hold during second-half 2019. The main catalysts include a rebound in NAM—pushed back by a quarter or two—and continued offshore recovery. LNG is another market on the cusp of an upcycle, with an oncoming infrastructure build-out. While upstream budgets should increase overall in 2019, the risk of negative revision is more pronounced than in prior years, as their survey was conducted while oil prices fell 20%, a reduction not seen since the 2008 financial crisis, West continued. Evercore also analyzed actual spending for 2018 and planned expenditures for 2019. U.S. capex growth will moderate to 10%, y-o-y, after a blistering 23% increase in 2018 and 49% gain in 2017. Overall, 2019 capex should be up around 100% from the 2016 trough, but down about 30% from the 2014 peak.
Commodity prices. WTI and Brent oil prices rose after January 2018, from around $63 and $69/bbl, respectively, in the first part of last year, before topping out at $70 and $81/bbl in October. But in late 2018, crude benchmarks declined 18% in November and continued on a downward trajectory, as WTI plunged to just $42.50 on Dec. 24, only to jump back to over $48 on Jan. 4. Brent fell to $50.47 on Dec. 24, and then rose to $57.35 on Jan. 4. To bolster benchmark prices, OPEC+ quickly implemented production cuts to support prices. Henry Hub spot natural gas prices averaged $3.15/MMBtu in 2018, up $0.16/MMBtu from 2017. HH prices surged to average $3.94/MMBtu in November, but quickly retreated to historical levels after harsh winter forecasts were revised. EIA predicts that HH gas will average $2.89/MMBtu in 2019 and $2.92/MMBtu in 2020.
Drilled-but-uncompleted. The number of DUCs in the U.S. continues to build at an alarming rate. As of November, DUCs hit an all-time high of 8,723, 18.6% more than reported by the EIA a year earlier. The lack of pressure pumping equipment is not a major factor, but service costs are a concern. Evercore estimates that frac supply increased almost 5 MM HHP, or 27% over the past year. But despite an excess supply of frac equipment and in-basin frac sand, the Permian’s DUC inventory increased 55% over the past year, followed by the Anadarko basin (16%), Eagle Ford (9%), Haynesville and Bakken (both up 8%).
LNG exports. The EIA expects U.S. LNG exports to increase from 3.0 Bcfd in 2018 to 5.1 Bcfd in 2019, and to 6.8 Bcfd in 2020, as three new liquefaction projects come online. The agency also predicts that U.S. LNG export capacity will almost double by the end of 2019, to 8.9 Bcfd. This will make U.S. LNG export capacity the third-largest, globally, behind Australia and Qatar. By mid-2020, EIA expects U.S. LNG export capacity to reach 9.6 Bcfd.
Oilfield service companies. In the short-cycle, shale-dominated environment, it has become challenging for service sector companies to manage their supply chains and logistics. Before the rapid decrease in oil prices, most pressure pumping companies expected a slowdown in completion activity, starting in the third quarter, as companies experienced budget exhaustion. The sector kept its supply chains intact to prepare for a rapid buildup in activity, early in 2019, when budgets are refreshed. Now, after recent downgrades from SLB and LBRT, it appears 2019 is off to a slower start than many expected (Evercore).
Meanwhile, pricing rebounded in 2017, as service providers began reversing concessions ceded during the downturn. Pricing has largely begun to rise across all segments and geography. Evercore estimates that overall pricing has improved 45%-55% for land-based operations from trough levels established during the 2014-2016 downturn.
U.S. FORECAST
Despite an unprecedented build-up of DUC wells in the major U.S. shale basins during 2018, operators working the various plays plan to add to the backlog during 2019. Drilling units may not be added as rapidly in 2019 as in 2018, but if Saudi Arabia continues to cut production to support oil prices, U.S. companies will continue to drill and complete wells until operations reach the break-even cut-off. With 8,723 DUCs waiting on completion in the U.S., it’s difficult to understand why operators are willing to strand more capital before securing an ROI on their previous drilling investments. But World Oil forecasts the trend will continue in 2019. As mentioned earlier, U.S. drilling is forecast to rise 4.0% in 2019, Table 1.
As expected, the Permian remains the major target for companies adding oil reserves. However, major leaseholders in Oklahoma’s STACK and SCOOP plays are predicting that the area’s multi-pay zones, well-established infrastructure and a competitive service environment closely resemble the Permian in early days. These factors, combined with a favorable political environment, should advance this dual play into second place, in terms of total commingled footage and wells drilled.
Gulf of Mexico. After four years of declining drilling activity in the GOM and a 17% drop during 2018, World Oil predicts a 7.7% increase in drilling and an 8.3% jump in total footage. Although increased efficiencies in subsea methods have reduced break-even costs to $40/bbl, we don’t foresee a meaningful resurgence in deepwater drilling during 2019–2020.
U.S. REGION-BY-REGION ACTIVITY
As alluded to earlier, nationwide drilling was up 12% last year. And while a 4.0% increase is expected this year, there is a definite disparity between healthy shale states and the more conventional states still struggling.

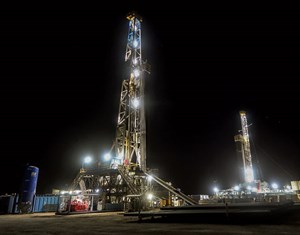
Texas. Shale drilling continues to dominate the Lone Star State, as the state gears up to boost activity 3.6%, Fig. 1. Activity levels in the Permian and Eagle Ford pushed Texas oil production to 4.986 MMbopd in November, a 2.4% y-o-y increase. The relentless drive to stack multiple wellbores into ever-shrinking sweet spots has increased the DUC count to 4,039 wells. The idle Texas wellbores account for 46.3% of the U.S. DUC total, as of November.
Stranded capital is cause for concern, but companies plan to push activity up 4% in District 8, and 14% in District 7C. The drive for ever-longer laterals will increase footage in District 7C 15.4%, and 5% in District 8. The increased crude output also produces a significant amount of casinghead gas. Although some gas is flared, the existing infrastructure in West and Central Texas enables operators to sell the rich, wet gas to midstream companies.
The increased gas volume has led to bust scenarios in Districts 3, 4 and 10, which we predict will suffer 12.3%, 25% and 12% declines in drilling activity, respectively. Districts 5 and 7B also will decline, with losses of 17% and 16%, respectively. Total combined activity in Texas will increase 3.6% during 2019, with footage up 3.5%. On another positive note, new oil pipelines, with combined capacity of 1.8 MMbopd, are being constructed to alleviate transportation issues.
Southeast. This region is set to increase 4.2%. In northern Louisiana, several operators plan to increase activity in the Haynesville shale to boost gas production. Additional activity is planned by small companies to drill shallow oil wells, to maintain production in mature areas. Drilling activity in the northern half will be up 4.1%, with footage increasing 7.4%, due to longer Haynesville laterals. In southern Louisiana, activity is recovering at a more rapid pace with footage forecast to increase 7.2%, and well spuds jumping 5.8%.
Northeastern states. This region will be up slightly in 2019. A massive winter storm that hit the Northeast in January 2018 caused unprecedented withdrawals and pushed spot prices for natural gas to record levels in New York state and at Henry Hub. According to the EIA, HH product hit $6.24/MMBtu on Jan.3 before retreating to historical levels. Producers also are eagerly awaiting start-up of two gas pipelines in the Appalachia basin and ramp-up of the Cove Point LNG facility. Despite the trifecta of positive news, activity in the Marcellus-Utica shale play appears to be slowing down. After impressive increases in Pennsylvania (23%) and West Virginia (26%) in 2018, World Oil forecasts a 9.6% reduction in West Virginia, and a relatively modest increase in Pennsylvania of just 7%. After suffering an 18% reduction in 2018, we forecast Ohio’s activity to drop another 11% in 2019.
Midwest. Drilling will be up a modest 3.0% in this region. In Michigan, the factors affecting drilling activity are commodity prices, and possibly rig availability. And officials say those two may be related. Illinois, for many of the same reasons as Michigan, remains at about half to a third of its traditional drilling level, although a few operators are exploring deeper horizons. Like other states, Indiana’s operators cite price and political uncertainty as major factors limiting drilling. However, given the high proportion of small operators, their inability to afford the cost of technology, to find new locations to drill, is also a factor.
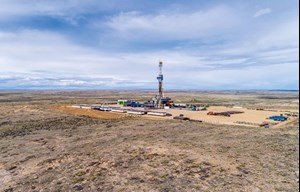
Mid-continent. We forecast solid, 9.5% growth for this area. The SCOOP and STACK plays of Oklahoma continue to gain momentum, due to application of updated technologies and completion practices tailored for the unique petrology of the Springer, Woodford and Meramec reservoirs, Fig. 2. Regional activity continues to be dominated by large and midsized independents, including Continental, Newfield, Devon and Cimarex. During 2019, we predict that Oklahoma’s activity will increase 14.4% overall, with a 15.7% increase in footage. After declining to 420,000 bopd in 2015, the state’s production has risen 38% to 580,000 bpd.
The oil-rich Bakken shale of North Dakota has been slow to recover since the 2016 bust. However, based on figures from state officials and our own survey of operators, World Oil forecasts that drilling will increase 3%, with footage up 3.3%. We predict the trend to laterals in excess of two miles will continue through 2019, with some wells reaching an MTD of 21,000 ft. With oil transport from the remote location still an issue, we predict a muted recovery, compared to other major shale plays.
In conventionally oriented Kansas, operators continue to drill shallow oil and gas wells, but at a much-reduced level that is only about one-third to one-fourth of pre-2015 figures. With investor attention focused on shale plays in other states, operators are finding it difficult to access additional capital needed to increase their drilling.
Rocky Mountain states. This mixed-bag region is forecast to increase 5.3%. During a yearlong debate in Colorado during 2018, Proposition 112 was put on November’s ballot. Calling for 2,500-ft setbacks, it would have effectively ended new oil and gas development in the state. Although defeated, the proposition cast a die that could resurface in Colorado and other states. Despite the unfavorable politics, operators will drill 3.2% more wells and 4.5% more footage. State production hit 478,000 bopd in November, up 6.2% from a year earlier.

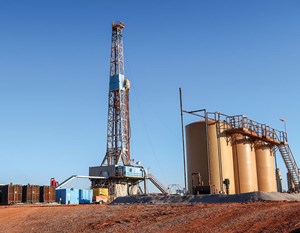
On the Wyoming side of the Niobrara shale, operators plan a 7.3% ramp-up in drilling activity, making 8.2% more hole in 2019, Fig. 3. State production is also rising, pushing up to 262,000 bopd in November, a 5% y-o-y increase. In northeastern Utah’s multi-horizon Uinta basin, activity and footage will both decline 2.1% in 2019, following a 17% drop in drilling activity in 2018. Approximately 67% of the state’s mineral acreage is controlled by the U.S. BLM.
Although New Mexico was late to the Permian shale boom, that situation started changing in 2017-2018 and will continue to increase during 2019. As completion efficiencies are increased in the Bone Springs formation of southeastern New Mexico, the state should reap an annual 6.8% gain in drilling activity in 2019 and an 8.5% gain in footage.
On the West Coast, we expect a 9.1% decline in drilling. California’s drilling activity has been up and down over the past several years. After enduring a brutal 80% reduction during the 2014-2016 bust, the state enjoyed a hearty 31.5% increase during 2018. However, this year, onshore operators are expected to reduce drilling and total footage 10.2%. Offshore California, we expect a 25% decrease in activity and a 15.4% reduction in total footage. As in previous years, most drilling is conducted by just four companies. The 107-year-old, multipay Elk Hills field in Kern County is still going strong, with approximately 2,300 active oil wells. Despite erratic drilling, operators pumped 481,000 bopd in November, about the same as one year ago.
The 2016 oil price collapse severely damaged Alaska’s offshore drilling industry. Despite the slowdown, offshore work in the Cook Inlet will remain steady, with 10 wells forecast for 2019, the same as drilled in 2018. Onshore activity on the North Slope is projected to increase 1.9%, with total footage increasing 2.7%. In a politically significant action, the Trump administration last October authorized Hilcorp Energy’s plan to build an artificial gravel island in the Beaufort Sea north of Alaska and use it to extract crude. This marks the first approved oil production facility in federal Arctic waters. ![]()


- The last barrel (February 2024)
- Oil and gas in the Capitals (February 2024)
- What's new in production (February 2024)
- First oil (February 2024)
- E&P outside the U.S. maintains a disciplined pace (February 2024)
- Prices and governmental policies combine to stymie Canadian upstream growth (February 2024)
- Applying ultra-deep LWD resistivity technology successfully in a SAGD operation (May 2019)
- Adoption of wireless intelligent completions advances (May 2019)
- Majors double down as takeaway crunch eases (April 2019)
- What’s new in well logging and formation evaluation (April 2019)
- Qualification of a 20,000-psi subsea BOP: A collaborative approach (February 2019)
- ConocoPhillips’ Greg Leveille sees rapid trajectory of technical advancement continuing (February 2019)


