Industry at a glance
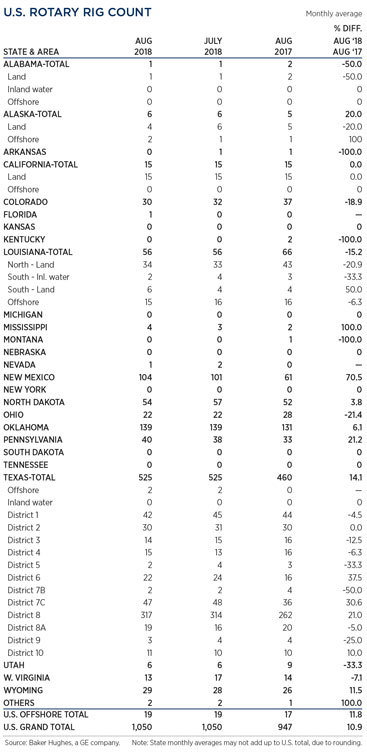
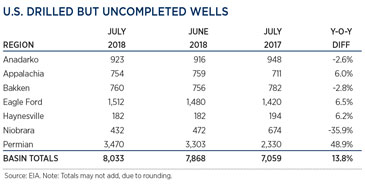
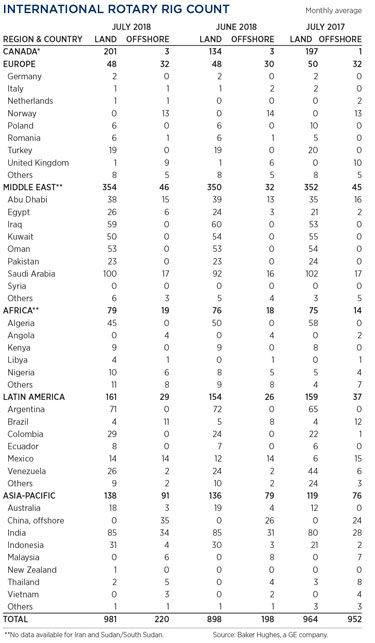
OPEC crude production rose to 32.74 MMbpd in August, the highest level this year, as an increase of 310,000 bopd in Libya helped offset a 240,000-bopd reduction in Iranian output (Bloomberg). Although sanctions don’t take effect until November, Iran is losing market share, as the U.S. imposes penalties on buyers. Russia upped its production to 11.21 MMbopd in August, while Saudi Arabia increased output by 20,000 bopd from 10.37 MMbopd a month earlier. The U.S. rig count averaged 1,050 in August, the same as July, despite a build of 167 DUCs in the Permian basin. However, operators working Colorado’s Niobrara play reduced their DUC backlog by 40, down to 432. International activity increased 9.6%, to average 1,201 in July, due mainly to a surge of 67 rigs in Canada.
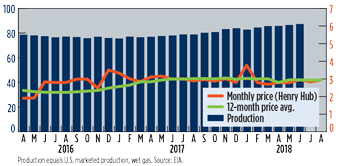
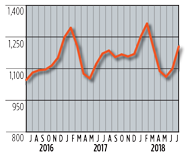
U.S. GAS PRICES ($/MCF) AND PRODUCTION (BCFD) GRAPH
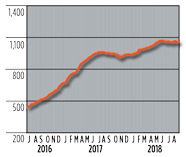
U.S. ROTARY DRILLING RIGS GRAPH
U.S. ROTARY DRILLING RIGS TABLE
U.S. DRILLED BUT UNCOMPLETED WELLS
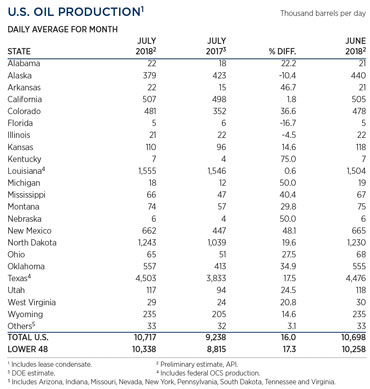
U.S. OIL PRODUCTION TABLE
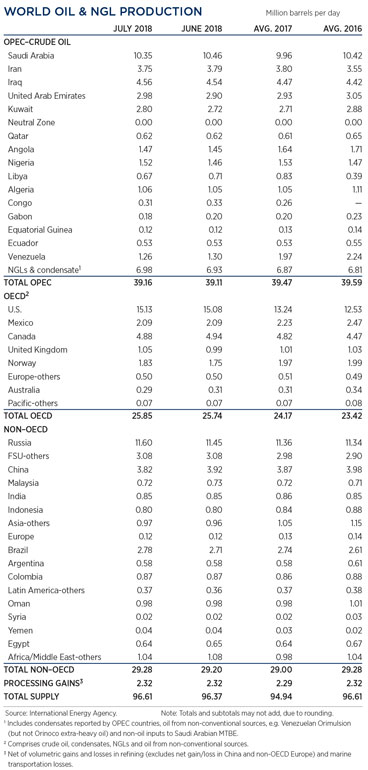
WORLD OIL PRODUCTION TABLE
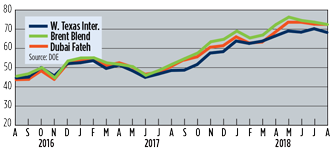
SELECTED WORLD OIL PRICES GRAPH
INTERNATIONAL ROTARY RIG GRAPH
INTERNATIONAL ROTARY RIG TABLE
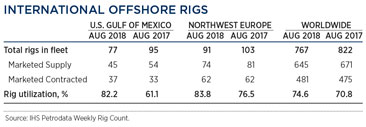
INTERNATIONAL OFFSHORE RIGS TABLE


