Direct drillstring measurements in drawworks improve autodriller performance
Over the past several years, direct measurements using an integrated drillstring measurement system have been collected while drilling. The new information has been compared with data taken by traditional surface sensors and downhole tools. However, without integration into the control system, the value of direct drillstring measurements was limited to advisory functions, such as: 1) providing early warning signs of system failure and well control situations; and 2) enhancing recommendations for drilling optimization and best well construction practices.
Direct comparisons were made with traditional sensor measurements at low sampling rates, to assess hoisting performance, WOB sensitivity, and torque performance. High-frequency sampling illustrated sensor capabilities to measure axial/torsional drillstring dynamics and pressure pulse characteristics. Internal testing also confirmed that the direct drillstring sensor provided opportunities to make accurate real-time dynamic response predictions when feeding data through analytical routines. These predictions included axial/lateral vibrations and estimations of downhole torque/speed responses at high frequencies.
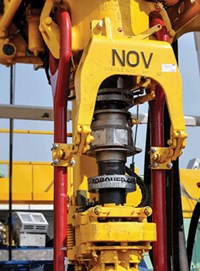
While these past findings provided compelling observations that demonstrated the system’s ability to optimize performance and improve drilling efficiency, quantifiable proof had yet to be collected. The direct drillstring sensor’s data were implemented recently into the drawworks control system of a jackup rig operating in the Gulf of Thailand, Fig. 1. The controls integration provided an opportunity to extract measurable drilling performance gains when using the sensor data in the WOB control loop. Eight parameters were used to quantify performance in three categories: 1) drilling dysfunction; 2) drilling metrics and; 3) controllability. The test results confirmed that the direct measurement system improved performance in each of these areas.
TEST PROTOCOL
During a one-year period, the drillstring sensor system was tested in three separate phases. The analysis included rig integration testing and sensor functionality assessment, and culminated with an examination that provided direct in-the-loop feedback to the autodriller drawworks control system. The new data were initially aggregated and logged in a drilling controls system at 10-Hz sample rates before downloading for review. Information describing well geometry, formation lithology, and BHA were extracted from morning reports and mud logs.
PHASE 3 RESULTS
Although three batches of test procedures were performed, Phase 3 delivered the most conclusive results and are the subject of this article. The findings were separated into three categories: 1) drilling dysfunction; 2) drilling metrics and; 3) controllability.
Drilling metrics. Limited data point sampling from the deadline anchor presented issues that prevented conclusive results. The primary problem was that the limited sampled deadline anchor data points can lead to inaccurate well-by-well comparisons. For example, data analysis results on a per-well basis indicate that the deadline anchor has better ROP performance, yet greater WOB control error.
On closer inspection, the ROP’s dependence on depth is primarily the reason this is a false comparison. Penetration speed is a function of depth, and shallower depths yield higher ROP averages. The highest ROP average per well was recorded by the deadline anchor (Well-1), in a condition in which only the first 22 stands were drilled with WOB control and the deadline active. The lowest ROP average per well was also recorded on Well-1, using the direct drillstring sensor. However, this was an average of the last four to five stands at the deepest parts of the well.
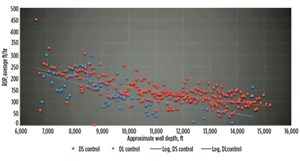
The ROP decrease, as a function of depth, is substantial.In fact, the stands drilled/hr speed is less than half in the well’s deeper sections, compared to shallower borehole. These substantial ROP performance variations, across the drilled depths, coupled with the limited use of the deadline anchor sensor for WOB control, required a more thorough statistical approach to analyze the acquired drilling data. To solve the issue, statistical metrics were calculated per stand and tabulated as a function of depth. There were no corrections for well-to-well variations, because information from the mud logs illustrated similar geological formations and drilling conditions.
Establishing data control baselines. The data point scatter from this approach appeared random, making it difficult to identify performance patterns. It was clear, however, that the substantially greater number of direct data points taken appear to have a tighter, more consistent grouping, as compared to the larger scatter or deviation of the deadline points in both ROP and absolute WOB error. Unfortunately, the data spread across depth (i.e., limited data at deeper depths) is not as consistent for the deadline points and could lead to error in the analysis. Applying the least squares method reveals the trends associated with the statistical data in a controlled manner and quantifies the ROP spread by plotting the standard deviation (STD). ROP variation over 8,000 ft, calculated for each stand, indicates that the STD is more than two times lower when using a direct sensor with the autodriller, rather than deadline control.
The STD is calculated from the sampled data at 10-Hz for each stand. A critical observation from this calculation is that, except for the initial stands, the ROP variation is larger when using the deadline anchor. Also, its STD increases as a function of depth, diverging from the STD calculated from data measured with the drillstring sensor for WOB control. Furthermore, the margin for ROP variation is higher for the direct sensor data, because it is captured over several additional wells. At deeper depths, the difference in STD trends between the ROP data of the drillstring sensor vs. the deadline anchor is quite significant, with a magnitude of more than 50 ft/hr. Perhaps the most significant illustration of the performance improvement using the drillstring sensor is the direct comparison of ROP averages per stand, Fig. 2.
ROP data trends for direct sensor WOB control are consistently higher than those of the deadline sensor (red and blue traces, respectively). This is a meaningful observation, as it compiles data across six wells, each consistently exhibiting faster drilling speeds, with the drillstring sensor updating the WOB control loop as opposed to the deadline anchor. The drilling rate increases at shallow depths are 10-20 ft/hr, but they increase to more than 50 ft/hr at deeper hole depths. The substantial ROP improvement at deeper depths indicates that there could be value added when using the drillstring sensor to push the limits of extended-reach wells.
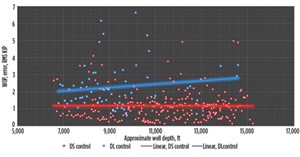
The reason behind the ROP increases when using the drillstring sensor is the improvement in the system’s closed-loop response. Therefore, from the previous ROP observations, the WOB error should diverge as depth increases. Moreover, the error with the deadline sensor control should be greater at all points than the error resulting with drillstring sensor use. This is substantiated in Figure 3, where the data trends display a diverging pattern, with the deadline sensor (blue) trend diverging from the drillstring sensor line (red).
Comparing the blue and red traces shows the WOB error is higher with the deadline sensor active. These data points were calculated by averaging the absolute magnitude of each error value. This method was used, because the error signal fluctuates around zero, create near-zero average values. The root-mean-square (RMS) method also was used with similar results. The error metrics show that the control system with deadline anchor feedback has more than twice the error at deeper depths than does the control system with direct sensor feedback.
Dysfunction identification. Drilling dysfunction causes inefficiencies and can lead to premature tool wear and/or expensive downhole tool failure. In theory, more stabilized, increased bit-weight control should result in reduced drillstring vibrations. Results in the previous sections have demonstrated improved drilling performance when assessing key metrics while using closed-loop WOB control with the direct drillstring sensor. It is assumed that reductions in axial and torsional vibrations also will occur with the use of the drillstring sensor closed-loop WOB control.
However, downhole tool data were not available to measure drilling dysfunction. Fortunately, the direct drillstring measurements have demonstrated the sensor’s ability to measure axial/torsional drillstring dynamics. The 10-Hz sample rate will limit the calculated response spectrum to less than 5-Hz. Previous experiments have shown much of the vibrational energy concentrated around the drillstring’s natural frequency to be less than 5 Hz at these depths.
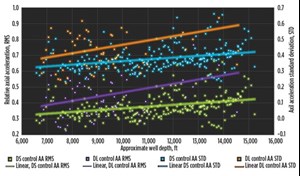
Additional calculations were performed to quantify dysfunction using two methods: 1) statistically comparing the calculated drillstring axial and tangential accelerations, and; 2) evaluating the power spectrum of torque and axial acceleration. These metrics indicate relative severity of change rates in the forces imparted on the drillstring along its drilling axis (axial) and around the drilling axis (torque/tangential). Metric decreases indicate a reduced degree of dysfunction that potentially could prevent damage and/or reduce wear on downhole tools.
Evaluating the axial acceleration of the drillstring for control with both sensors suggests that drilling dysfunction increases when using the deadline anchor for feedback. The data traces confirm this observation, Fig. 4. A fit of the data points from the RMS and STD of the derived axial accelerations (normalized) illustrate a higher response when using the deadline anchor for feedback. Additionally, the best fit traces for STD and RMS, using deadline control increase in value more rapidly as the hole depth increases.
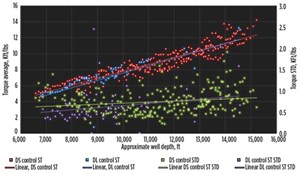
Torsional vibration was analyzed by comparing torque statistical data points and calculated rotational acceleration data. Figure 5 displays torque data averages (red and blue traces), showing a similar pattern as a function of depth, expected since the formation geology and well plans are similar among wells.
The STD calculated for each stand is also similar when comparing the deadline control (purple) with drillstring control (green). A larger variation was expected, and thus a higher STD, when using the deadline sensor in the control loop, but this was not evident, and therefore, conclusions could not be drawn.
Results from the calculated tangential acceleration, derived from the rate gyroscope, show that the direct sensor feedback is slightly worse than the deadline anchor, when comparing their data trend lines. Both STD and RMS values show a relative increase when using the drillstring sensor (blue vs. orange and green vs. purple). These results are somewhat counter-intuitive and may be due to resolution limitations of the rate gyroscope, as the difference is quite small.
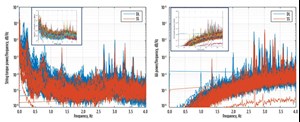
A better approach for torsional and axial vibration evaluation is to compare the power spectrums of torque and axial accelerations during the times when WOB control is active with each sensor. Data from a specific well was used, because it contained data using both sensor sources for control. As expected, the response is similar for both sensors when evaluating torque and axial acceleration. However, the power spectrum magnitudes are slightly larger when the deadline sensor is active, indicating higher vibration magnitudes and thus greater dysfunction, Fig. 6. The overlays illustrate a marginal performance increase when the direct drillstring sensor is engaged, as shown by the lower-magnitude peaks (orange). The main figures show all stands combined as two colors: blue trace (deadline active); and orange trace (drillstring sensor active). Inset windows illustrate each individual stand of data calculated as different color traces.
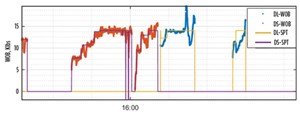
Time-domain observation. The best data set to demonstrate time-domain performance comparisons was the well that alternated regular drilling intervals with deadline anchor control, followed by drillstring sensor control. Similar to the Phase 2 results, the system response is most clearly seen when the control loop sensor was switched while drilling in the middle of a stand. The system response characteristics are timelier with the direct sensor (orange) and has a tighter following error band around the set points, Fig. 7.
SUMMARY
A direct drillstring measurement sensor was integrated recently into a jackup rig’s drawworks control system for WOB autodriller control.
Phase 3 results with the direct drillstring sensor in control are summarized
as follows:
- Drilling metrics:
- ROP increases took place across the entire depth range, with growing 10-50 ft/hr magnitudes.
- ROP improvements were greatest at the deepest hole depths.
- Controllability metrics:
- WOB error was smaller, with a two-fold reduction at deeper hole depths.
- Time domain, closed-loop system characteristics were improved.
- Dysfunction metrics:
- Axial acceleration magnitudes decreased statistically for the entire well set.
- Axial acceleration magnitudes were reduced marginally from calculated power spectrum response, when examining the frequency response of axial data for the sensor-switching well.
- Torsional/tangential magnitudes did not improve from the statistical data for the well set.
CONCLUSIONS
The data collected from the offshore jackup rig provide substantial evidence that a direct drillstring sensor improved autodriller control, and improved drilling performance when used to provide measurement data to autodriller control loops. Improved system stability and sensitivity enabled the transfer of more consistent weight control to the drillstring, increasing ROP by 10 to 50 ft/hr—the higher increases at deeper depths—verifying the direct sensor’s usage in extended-reach drilling applications.
Along with improved drilling performance, results showed that the direct sensor’s increased bit-weight control also reduced drilling dysfunction for all Phase 3 test wells, especially with respect to axial drilling vibration reductions. Power spectrum comparisons of torque and axial accelerations for the sensor switching well, when each sensor controlled WOB, showed lower power magnitudes for the direct drillstring sensor, indicating lower vibration magnitudes—both axial and torque—and thus reduced overall drilling dysfunction.
Future enhancements include tuning and filtering for autodriller optimization and integration of other direct drillstring measurement data primarily, torque, rotation speed, and pressure. ![]()
ACKNOWLEDGMENT
This article was adapted from SPE paper 187043, which was presented at the SPE Annual Technical Conference and Exhibition, San Antonio, Texas, Oct. 9–11, 2017.


