Water management attitudes, practices still evolving in the U.S.
In an effort to better understand the upstream industry’s attitudes and practices toward water management in the U.S., World Oil conducted a survey of 68 companies during September 2018. The firms represent a mix of mostly operators, drilling contractors and engineering consultants. We note that all 68 respondents said that they are involved in their respective companies’ water management programs. What follows is analysis of survey results concerning current practices, as well as a look forward to what might be done by companies to better handle their water management.
GEOGRAPHY
The World Oil survey elicited responses from companies involved in a wide swath of shales, basins and formations requiring water management practices, Table 1. Not surprisingly, the area with the greatest number of operators in the survey is the Permian basin of West Texas and New Mexico, followed by the Bakken shale and Williston basin of North Dakota, the Eagle Ford shale of South Texas, and the Marcellus and Utica shales of the northeastern U.S.
Additional primary areas with operator participation include the Woodford shale (Okla.), Haynesville shale (La.), Western Canadian shales, Niobrara shale (Colo.) and Granite Wash formation (Texas/Okla.). Other areas in which respondents mentioned that they have activity are the Antrim shale (Mich.), Powder River basin (Wyo.), Bighorn basin (Wyo.), Woodbine formation (East Texas), and Piceance basin (Colo.). Eleven firms said that they were active outside the U.S. and Canada.
CURRENT PRACTICES
The first major section of the survey involves current attitudes and practices by industry companies, in carrying out water management programs.

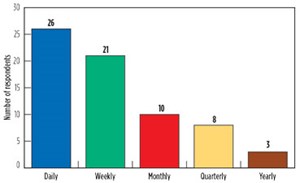
Interaction with systems and practices. We asked survey respondents how often they interacted with their companies’ produced water treatment systems and practices. Results show that a significant majority, 47 of 68 (69%), were working with their firms’ systems and practices on either a daily (26 or 38%) or weekly (21 or 31%) basis, Fig. 1. Another 10, or 15%, worked with water treatment at their companies on a monthly basis, followed by eight that had some interaction quarterly, and three that only had yearly exposure.
Disposal wells. On the subject of whether they use disposal wells, we see one of the more lopsided trends in respondents’ answers. A resounding 52 of 68 respondents, 76%, said that their companies use disposal wells. A minority of 16, or 24%, replied “no” to the question of utilizing disposal wells.
In terms of regional trends, the greatest use of disposal wells was 77% of companies in the Permian basin, along with 75% in the Woodford shale and 63% in the Eagle Ford shale. The combined Bakken shale/Williston basin had only 47% usage.
Produced water handling. In response to the question, “What steps does your company take to handle its produced water,” some companies mentioned one method, and others listed multiple methods. Thus, we have 115 responses from the 68 companies. Forty-three responses, 37%, listed disposal as a method utilized to handle produced water. Another 35 responses, 30%, listed re-use, either for drilling, completions or EOR. Another 31 responses, 27%, were tallied for treatment, either for solids or contaminants. Other uses scored six responses.
Not surprisingly, the region with the greatest usage of disposal wells for handling produced water is the Permian basin. A solid 65% said that they use disposal wells, followed by the Marcellus and Utica shales in the northeastern U.S., with 64%, plus 63% of Woodford shale operators. Conversely, none of our survey companies active in the Niobrara shale and Granite Wash formation use disposal wells for produced water in those areas.
The highest percentage of firms in a region re-using produced water was 88% in the Woodford. The second-highest percentage was 65% of companies in the Permian basin. As for use of treatment to remove solids and contaminants, the highest percentage of use, 50%, was found among respondents working in the Permian basin, and the Bakken and Woodford shales. The lowest rates of usage were among companies working in the Niobrara and Eagle Ford shales.
Recycling. The question, “What percentage of your company’s produced water is recycled,” generated one of the more diverse sets of answers. At one end of the spectrum, some companies have little or no recycling, while other firms said that all or almost all of their produced water is recycled. That having been said, a solid majority, 40 of 68 respondents, said that 40% or less of their produced water undergoes recycling. Comparatively, a significant minority of 16 respondents said that their firms recycle 61% or more of their produced water. The remaining 12 respondents were in the moderate recycling zone of 41% to 60%.
In terms of regional usage, the highest percentage of recycling 81% to 100% of produced water occurred among companies working in the combined Bakken/Williston region (24%) and in the Permian basin (15%). Somewhat surprisingly, the highest rate of firms recycling only 0% to 20% of their produced water was in the Marcellus/Utica region (57%), as well as the Eagle Ford shale (44%).
Automation. Here is another category, where a clear majority of respondents trended toward one end of the spectrum. In response to our question, “How much automation does your company employ in its current water management solution,” 46 out of 68 respondents, or 68%, said either “some” (39) or a “heavy” (7) amount. The other 22 firms answered “no” (8) or “minimal” (14) automation.
LOOKING FORWARD
This second and final major section of the survey involves companies’ attitudes toward new water management technologies, and the roles that should be played by alternative water sources, disposal wells, and automation. This section also gauges what improvements should be made to existing treatment technologies.

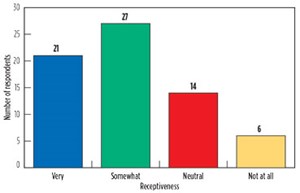
Adopting new technologies. At least on paper, a majority of operating industry companies say that they are receptive to new water treatment technologies. A solid 48 of 68 respondents, or 71%, said that they were “very receptive” (21) or “somewhat receptive” (27) to new water treatment methods, Fig. 2. Another 14 companies (21%) were “neutral,” and just six firms said that they were “not receptive.”
Alternative water sources. While most companies say they are investigating, or are open to, new water treatment technologies, they appear to not be nearly as ready to embrace so-called “alternative water sources,” such as municipal discharge, acid mine discharge (AMD), etc. Only 31 firms, 46%, are actively looking at alternative water sources. The remaining 37 companies, 54%, said that they are not considering these sources at this time.
Disposal well utilization. In recent years, the well-publicized earthquakes in Oklahoma, and now the Texas Panhandle, have been blamed on over-utilization of disposal wells. However, that doesn’t mean that a majority of companies in our survey group are stampeding to discard the practice. When asked, “Is your company planning to reduce its utilization of disposal well injection, due to induced seismicity?”, only 10 firms (15%) said “yes.” Another 20 companies (29%) said such a move was “under consideration.” A significant majority, 38 (56%), said that they had no plans to reduce utilization at this time.

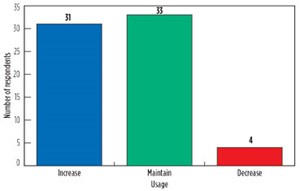
Automation. Unlike some other categories, there is no doubt as to where companies stand on the subject of whether to increase, maintain or decrease their current levels of water management automation, Fig. 3. An overwhelming 64 of 68 respondents (94%) said that they would either increase (31) or maintain (33) their level of water management automation. Only four companies indicated that they would decrease their level of automation.
Unplanned shutdowns. We asked survey participants to tell us what improvement(s) they think would be needed to significantly reduce unplanned shutdowns of their companies’ produced water treatment systems. This question elicited a wide range of answers, yet we were unprepared for, and somewhat surprised by, the leading answer, which was “none” or “don’t know.” The fact that 28 companies (41%) gave this answer certainly indicates that for many of them, their produced water treatment systems are works in progress.
Despite this large group, there are some firms that have a sense of direction on the subject, Table 2. Eight of them (12%) said that they thought the answer was better or appropriate maintenance programs, while another seven (10%) felt that it should be disposal costs and/or solutions. Remote monitoring of wells got five votes, while filtration was preferred by four companies. Rounding out the most-mentioned improvements were three votes for more investment and/or new equipment, as well as three votes for predictive failure analysis and/or equipment breakdown prevention. The remaining 10 responses covered a range of options, from better operator training to better chemicals and desalination.
Improvements needed. Rounding out the questions, we asked respondents, which produced water treatment technologies are most in need of improvements, Table 3. Once again, companies surprised us with their indecision. The leading answer from 21 respondents (31%) was “no answer” or “unsure.” However, there was a tie for second place with 12 answers, each, for desalination/removal of salts and H2S, and filtration. Eight respondents chose treatment for re-use. Rounding out the most mentioned answers were three for reverse osmosis and regulatory authorization/economics. Among the answers in Others were chemicals and waste/reinjection. ![]()


