Regional Report: Permian Basin
The venerable Permian basin is once again the bright spot in the industry. Pick nearly any metric for growth, and the good old Permian shines.
Permian production continues to increase, and it may reach 2.9 MMbopd by the end of 2018. That would be about 30% of total U.S. crude oil production next year. The rotary rig count, about 40% of the U.S. total, is 207 units ahead of last year. Railroad Commission drilling permits at mid-year are within 626 of the total issued in 2016.
There’s a lot driving this growth. Technological leadership in developing unconventional resources; an extensive and growing infrastructure; a skilled workforce; and a long stretch of painful cost-cutting have driven down expenses, and improved well economics to put some assets within reach of $40 oil. Production for the last half of the year is being hedged at a relatively low $50/bbl. And, lo and behold, WTI crude prices that were above $50 at the start of the year and flirted with $43 in June had rallied back to near $50 at the end of July.
The pace of mergers, acquisitions, and divestitures adds to the churn, with an influx of money, ownership and ambition. Properties continue to change hands at a blistering rate, building momentum from 2016’s $28 billion in land acquisitions. The year started with ExxonMobil’s $6.6-billion expansion and Noble Energy’s $2.7-billion agreement, followed quickly by Parsley Energy’s $2.8-billion addition and a slew of other deals.
All of this investment rests on massive, stacked pay resources sprawled across 86,000 mi2, two states and 52 counties. Today’s 2-mi laterals and multi-stage completions have come a long way, and through a lot of ups and downs from 1923, when Texon Oil and Land Co. brought in the Santa Rita No. 1. But, perhaps modern Permian basin wells haven’t ventured far in spirit from the original discovery near Big Lake. Spudded on the day that the permit was due to expire, the well struck oil after 21 months of cable tool drilling, and it produced for nearly seven decades.
RIGS, PERMITS, AND PRODUCTION NUMBERS
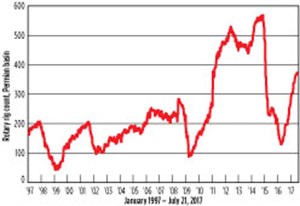
During the week of July 28, Baker Hughes counted 931 U.S. rigs, up from 440 last year. Texas had 462 rigs making hole (214 in 2016), and the Permian basin accounted for 379 of them—about 80% of Texas rigs and 40% of U.S. rigs. That’s up from a bleak 172 rotary rigs last year. (For perspective, the Permian basin rig count reached 568 in late 2014 before falling to a low of 134 in spring 2016, Fig 1.)
The Permian basin count breaks out to roughly 311 rigs in Texas and 67 in New Mexico’s Eddy, Lea, Chaves and Otero counties. That includes 32 vertical, seven directional, and 339 horizontal wells, all of them targeting oil, according to a WTRG Economics summary. More than half of those rigs are concentrated in just five counties, including: Reeves, Loving, Midland and Martin counties in Texas, and Lea County, New Mexico.
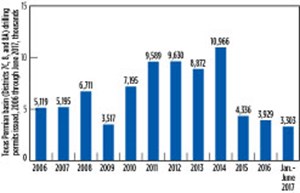
Drilling permits portend more good things to come, with mid-year permit numbers closing in on last year’s total, Fig. 2. Railroad Commission Districts 7C, 8 and 8A had reached 3,303 in June, versus a total 3,929 permits issued in 2016. In 2015, 4,336 permits were approved; and 10,966 were issued in 2014.
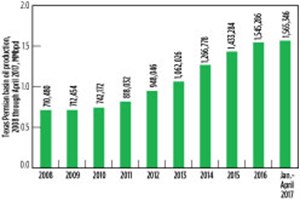
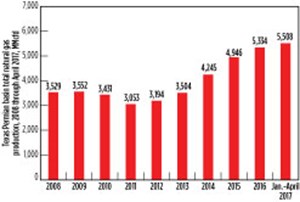
The Texas share of Permian basin oil production increased from 1.545 MMbpd in 2016 to 1.565 MMbpd through April 2017, according to the RRC, Fig. 3. Gas production continued to rise going from 5,334 MMcfd in 2016 to 5,508 MMcfd during January through April 2017, Fig. 4. Condensate production also gained, rising to 75,544 bpd from 69,941 bpd in 2016, and considerably above 7,322 bpd in 2010.
In New Mexico, Eddy County’s 2017 production is on track to exceed the 2016 total. Just through April, it was 24 MMbbl and 134 Bcfg (versus 2016 production of 63 MMbbl and 324 Bcfg), according to a summary of New Mexico Oil Conservation Division (NMOGCD) figures by DrillingEdge data services. Lea Countey garnered 34 MMbbl of oil and 112 Bcfg through April (compared to 74 MMbbl and 274 Bcfg in 2016).
The two New Mexico counties’ combined 2016 production was 137 MMbbl of oil and 408 Bcfg. In January, The Albuquerque Journal wrote that production from the two counties was leading output from Midland County, Texas. The newspaper cited 2015 figures from NMOGCD and the Texas RRC, showing that Lea County produced 70.9 MMbbl in 2015, and Eddy County produced 65.8 MMbbl, compared to Midland County’s 47.3 MMbbl. Eddy County’s 2015 gas production was 311.9 Bcfg, and Lea produced 227.2 Bcfg, while Midland County produced 155.9 Bcfg.
EIA OVERVIEW
The U.S. Energy Information Administration (EIA) said that it expects Permian basin oil production to reach 2.9 MMbpd by the end of 2018, up about 0.5 MMbpd from estimated June 2017 levels. That would be about 30% of total U.S. crude oil production. EIA forecast total U.S. crude oil production to amount to 9.3 MMbpd in 2017, up 0.5 MMbpd from 2016, Fig. 5. In 2018, EIA projects oil production will rise to 9.9 MMbpd. That would be the highest on record, surpassing the previous record of 9.6 MMbopd set in 1970.
The Permian basin, along with the Barnett, Eagle Ford, Haynesville, Niobrara, Bakken, Utica and Marcellus shale plays, accounted for about 92% of domestic oil production growth and all U.S. natural gas production growth from 2011 to 2014, according to EIA, Table 1. With production in other regions falling in 2015 and 2016, the Permian basin cumulated a growing share of U.S. crude oil production. Between January 2016 and March 2017, oil production in the basin increased in all but three months. In July, Permian oil production was roughly 1.1 MMbpd ahead of the Eagle Ford, the next most prolific oil producing play, Fig. 6. Gas production in the Permian was the second-highest, but amounting to about half of the top-producing Marcellus.
THE FED’S OUTLOOK
Despite a little uncertainty, the region’s business activity indexes remained robust, according to the most recent energy survey conducted by Federal Reserve Bank of Dallas. The Fed’s quarterly assessment of business conditions samples about 200 E&P and oilfield service companies in the Eleventh Federal Reserve District, which includes the Permian basin, Barnett, Eagle Ford and Haynesville.
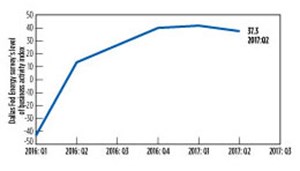
In the second-quarter survey, the uncertainty index was 35 versus 15.9 in the first quarter, with 46.7% of respondents reporting greater uncertainty. Nevertheless, the Fed’s business activity index, its broadest measure of conditions facing energy firms, was strong at 37.3 in the second quarter, and just slightly below the 41.8 reading in the first quarter, Fig. 7. The equipment utilization index also increased to 45.4, up from 26 in the first quarter.
Year-to-year, the business activity index for all firms decreased to 49.2 from 55.8 in second-quarter 2016. Among E&P respondents, the index was lower at 39 (compared to 57.1 in second-quarter 2016), while service companies set the activity index higher at 59.7 (compared to 54.4 last year).

The Fed’s capital expenditure index for all firms declined from 37.5 in second-quarter 2016 to 28.2, second-quarter 2017. Operators saw less outlay, which put the index at 39 this year versus 57 in second-quarter 2016, while oilfield service companies moved the index up to 39 this year versus 37.9 a year ago.
Labor market indices also showed rising employment, hours, wages and benefits. The Fed said oilfield service companies were the primary driver behind growing employment, as the service sector’s index amounted to 40.3, versus 8.7 for E&P firms.
The survey also found that on average, respondents expected WTI oil prices to increase to $48.79/bbl by year-end, and natural gas prices to hit $3.01/MMBtu.
MERGERS, ACQUISITIONS, AND DIVESTITURES
At the start of the year, energy intelligence firm Wood Mackenzie described a “fevered pitch of merger and acquisition activity in the Permian basin,” with the price per acre growing from $1,000 in 2012 to $50,000 in 2016.
Multiple drivers include stacked pay potential; large volumes; upwardly trending well economics; and the flexibility to adapt to a changing market. The result is a remarkable break-even reduction from $100/bbl in 2012, to $67/bbl in 2016, to as low as $40/bbl today.
Service sector costs are expected to increase this year, but not recover to 2014 levels, said the firm. In a January upstream report, analysts said area companies could see greater margins, as labor and equipment demand grows. The company’s base case for well-cost inflation is 10%. Pressure pumping and proppant are likely to benefit the most, with 20% inflation built on growing frac intensity and job size, and leveraged by market cannibalization and low repair and maintenance.
In the drilling segment, Wood Mackenzie foresees a modest cost inflation—as high as 10%. Drillers could see limited pricing power, as long-term contracts from 2014 end, and return to the spot market. Excess high-spec rig capacity was expected to extend into mid-year.
HEDGING POSITIONS
Hedging against oil and gas price fluctuations has been a common practice for most of 2015 and 2016, and it is continuing this year, affecting production from many basins. The Permian stands out in this regard, with a larger percent of production committed at lower prices, analysts said. Many large E&P firms are committed to relatively low prices for the year’s remaining production, according to a Bloomberg survey. At $50/bbl, Permian basin producers “tend to be hedging at lower prices than rivals centered on less attractive basins, such as the Bakken and the Eagle Ford,” said energy columnist Liam Denning.
Analysts at IHS Markit said in a July hedging study that oil-weighted Permian basin producers had hedged about 65% of remaining 2017 oil production, at an average strike price of approximately $50/bbl, and 50% of remaining gas production at $3/Mcf. In contrast, non-Permian producers had just 19% of oil production and 29% of gas production hedged. In this scenario, Permian basin E&P firms are less likely to reduce remaining 2017 spending plans and production targets than non-Permian counterparts.
The difference in hedging reflects a wide disparity in growth targets, IHS said. Median Permian basin E&P activity is expected to increase production by 25% during 2017. Producers outside the region are anticipating a median decline of 1.0% in oil/liquids production.
“In 2017, hedging is still important for these E&Ps, especially the more debt-laden companies, which are less likely to withstand sustained low prices or significant price fluctuations,” said Paul O’Donnell, principal equity analyst at IHS Markit and author of the hedging analysis. “The oil-weighted peer group increased its 2017 oil hedging from 22% to 34% since the time of our previous hedging study, based off of third-quarter 2016 data.”
PRODUCER ACTIVITY
It’s possible to fill a page with Permian basin players and hopefuls. Depending on interests, you can parse these producers by acres owned, capital budget, hydrocarbons produced, rigs running, feet of lateral, tons of proppant, or a myriad of other metrics. And it will all change with the next drilling report or the latest land sale. Here’s a sampling of some recent movers and shakers:
ExxonMobil subsidiary XTO Energy more than doubled its Permian basin resource potential in January, with the $6.6-billion acquisition of the Bass family properties in New Mexico’s Delaware basin. In the second quarter, the company spudded its first well on the new land and drilled a 12,500-ft lateral section.
The acquisition added 3.4 Bboe across 250,000 net acres, with multiple pay zones through a 6,500-ft interval. ExxonMobil said its Permian basin operations are focused on increasing efficiency through maximized lateral length, next-generation completion designs, and optimized field development.
Noble Energy’s $2.7-billion acquisition of Clayton Williams Energy in January added 71,000 contiguous acres in the core of the southern Delaware basin, in Reeves and Ward counties in Texas. The property abuts the company’s existing 47,200 net acres, and includes an additional 100,000 acres in the Permian basin. They have identified about 2,400 Wolfcamp drilling locations, with an average 8,000-ft lateral length. Noble plans to increase Clayton property production from the current 10,000 boed to approximately 60,000 boed in 2020. Enabled midstream assets include more than 300 mi of oil, gas, and produced water lines.
Noble said it would build on its 90-day-to-oil pace, leveraging technical expertise and rapidly accelerating activity. Two rigs were at work on the Clayton Williams acreage in the first quarter. Ongoing research includes efforts to optimize completion performance through testing of proppant concentrations, clusters per stage and stage spacing.
Parsley Energy in February said it would buy about $2.8 billion worth of Double Eagle Energy Permian assets. The Double Eagle deal adds about 71,000 acres to Parsley’s acreage in the Midland basin, bringing its total Permian basin acreage to about 227,000. A separate $607-million Permian basin acquisition was announced in January. At that time, the company raised its 2017 capital budget from between $750 million and $900 million, to the $1-billion-to-$1.15-billion range. It also revised full-year production to an estimate between 62,000 and 68,000 boed, up from a range between 57,000 and 63,000 boed.
Apache Corp. is busy with testing and delineating its Alpine High discovery in the southern Delaware basin, including lateral length, targeting, placement, and azimuth, frac design and size, and spacing and pattern. Three new test wells were drilled in the first quarter, with two delivering Apache’s highest 24-hr oil rates and highest oil cuts, to-date, in the Woodford and Barnett formations.
Long-term planning for development of Alpine High includes a strong component focused on environmental and safety
concerns. Efforts to protect groundwater include extensive baseline groundwater and surface testing, surface casing programs, detailed and continuous pressure testing, and monitoring of hydraulic fracturing operations. In conjunction with nearby McDonald Observatory, Apache is implementing Dark Sky standards to limit light pollution. Road safety initiatives include reducing the traffic load, community coalitions, and ride sharing.
Alpine High is estimated to have 75 Tcf of rich gas and 3 Bbbl of oil-in-place in the Barnett and Woodford formations, with significant oil potential in the shallower Pennsylvanian, Bone Spring and Wolfcamp formations. Apache has 320,000 contiguous net acres with a 4,000-to-5,000-ft wet gas and oil column, five distinct hydrocarbon-bearing formations, and more than 3,000 drilling locations.
In the greater Permian basin, the company has about 3.1 million gross acres and estimated proven reserves of 611 MMboe, accounting for about 31% of its total 2016 production. Apache’s $2-billion capital focus in 2017 includes a four-to-six-rig program in Alpine High. First gas sales in May were two months ahead of schedule and the play is producing 50-plus MMcfgd. Midstream development includes an additional 20 mi of 30-in. trunk line. Two expandable central processing facilities are in operation, and three are under construction. Five tank batteries are in service, and 11 more are in construction. Future projects include oil and NGL pipelines, and a dedicated line to the WaHa hub.
Apache’s Midland/Delaware basin activity includes a five-rig program, and increased pad drilling in core acreage in the Wolfcamp and Spraberry shales. Operations in 2017 include six primary rig lines and two frac crews. Apache plans to bring 32 wells online in the second half of the year, including two 10-well pads and a nine-well pad. Within these wells, 90% of lateral lengths are 1.5 mi or longer.
Anadarko posted record oil sales volume in the Delaware basin during the second quarter, averaging approximately 33,000 bopd, a 52% increase over the same period last year. Anadarko is in the final stages of securing operatorship for approximately 70% of the acreage position that was previously part of the joint-venture agreement that recently concluded with Shell. The company also expanded takeaway capacity, with an agreement to be an anchor shipper on a residue-gas line from the Western Gas Partners, LP (WES)-operated Ramsey plant and future WES-operated Mentone plant to the Waha area.
Chevron said accelerated development is a key aspect of its Permian basin plans, which include a continued drilling program that is adding a rig about every eight weeks. The company expects to have 20 operated rigs by year-end, and may add more next year and beyond. That could grow production to more than 700,00 boed within the next 10 years. Chevron said it also might swap, lease or sell between 150,000 and 200,000 acres. The company has a two-million-acre land position in the Permian basin, with about 1.5 million acres associated with shale and tight plays in the Midland and Delaware basins.
Pioneer Natural Resources said in June that it was operating 18 horizontal rigs in the Spraberry/Wolfcamp, where it expects to grow production by 30% to 40% this year. Of its 2017 $2.8-billion capital program, 95% is dedicated to Spraberry/Wolfcamp development. That includes a $1.9-billion drilling program, and infrastructure spending on tank batteries and gas processing facilities. Technology development continues to play a strong role in the company’s plans, including machine learning and artificial intelligence, predictive analysis, and 4D fracture propagation modeling. Version three of its frac design model is reportedly improving performance with larger treatments, using 1,700 lb/ft proppant concentrations, and shorter, 15-ft cluster spacing, and 100-ft stage spacing.
QEP Resources did a fast asset change in late July to build its Permian position. It first sold natural gas assets in Wyoming’s Pinedale Anticline field, and two days later bought $732 million in Permian basin properties. The purchase of 13,800 acres in Martin County increases the company’s Midland basin acreage by about 50%. Last year, the company bought about $600 million in properties in Martin County. The firm was operating five rigs in the first half of the year.
QEP said the new property has more than 730 potential drilling locations in four horizons—the Middle Spraberry, Spraberry shale, Wolfcamp A and Wolfcamp B. Reservoir characteristics are similar to its County Line, Mustang Springs, and Sales Ranch properties. About 60% can be developed with 10,000-ft laterals or longer. With the purchase, the company said it now has nearly 1,900 potential horizontal drilling locations in the core of the northern Midland basin.
Concho Resources said its production in the first quarter increased roughly 30% from 2016, averaging 181,400 boed. Its exposure in the Permian basin includes approximately 930,000 gross acres, with 720 MMboe of estimated proved reserves.
The company operated about 21 rigs during the first part of the year, up from 18 rigs in the previous quarter. Concho commenced drilling, or participated in, a total of 73 gross wells (57 operated wells) and completed 65 gross wells during the first quarter of 2017 in the Delaware basin, Midland basin and the New Mexico shelf.
The company is drilling its Mabee Ranch development in Andrews County. The project includes 13 two-mile wells, targeting five landings across the Spraberry and Wolfcamp zones. The development pattern implies 32 wells per section. Concho is using fiber-optic monitoring to assess lateral placement, well spacing and completion design.
In the northern Delaware basin, Concho has eight development projects with at least four wells each, including the Windward project in Red Hills. This project targets the Avalon shale with 2-mi laterals. Its Brass Monkey project in the southern Delaware basin is an eight-well project testing simultaneous development of the third Bone Spring and Wolfcamp with long-lateral wells. ![]()
Focusing on efficiency in the Permian basin
Backed by a low-cost environment and high reserves, activity in the Permian basin has returned at a faster rate than any other region in the U.S., since the beginning of the downturn. According to a March statement from an energy market intelligence firm, roughly half of all the rigs in the U.S. that have returned to service, since going offline in May 2016, have gone to the Permian basin. Though activity in the area has increased, keeping costs low is still a big driver. Operators are looking to drill longer laterals, pump large volumes of fluid, and place large amounts of proppant, without incurring a significant uptick in overall well costs. In this landscape, efficiency is of greater importance.
Completion efficiency
The advantages of ball-activated systems have been well-documented in literature. The continuous pumping operation of ball-activated systems efficiently initiates stimulation at the toe of the well; reduces time between stages; eliminates the risk of milling frac plugs in the toe of long, lateral wellbores; and reduces the overall amount of fluid required for stimulation and cleanup. All of these benefits result in significant cost-savings. Furthermore, the ability to immediately flow back the well after stimulation enables faster time to production.
One operator in the Permian basin, which was encountering operational challenges using wireline to perforate stages at measured depths greater than 20,000 ft, recently implemented a limited-entry ball-activated cemented solution at the toe of a well. Four limited-entry stages were installed that used clusters of Packers Plus TREX QuickPORT IV sleeves. One ball is used to open all of the sleeves run in a stage. Once the cluster of sleeves is open, the stimulation treatment can begin. Using a designed pump rate to maintain a desired pressure differential, the treatment is distributed through each sleeve in the select zone. The sleeve’s reinforced flow ports prevents entry point erosion, which helps maintain the designed limited entry treatment throughout the stimulation. This solution resulted in substantial cost-savings. Compared to plug-and-perf wells in the area, using four stages of QuickPORT IV sleeves saved approximately 14 hr of time on location.
Installation efficiency
A recently launched, premium liner hanger is also gaining traction in the Permian basin, due in part to efficiencies during system installation. Many liner hangers are set after pumping a setting ball to the toe of the well. To reduce the time and cost of pumping fluid all the way to the toe—particularly for longer laterals—the setting ball used with the Packers Plus PrimeSET liner hanger is, instead, retained in the running tool during setting operations. So far, the hanger has been installed successfully in a number of wells in the Permian basin, with measured depths up to 17,500 ft.
Operational efficiency
Making well-informed decisions on-site during operations is also a critical factor to increasing operational efficiency, and mitigating risks that avoid unplanned costs and NPT. The ePLUS Retina is a monitoring device that enables operators to verify surface and downhole events in real time, independent of data van monitoring.
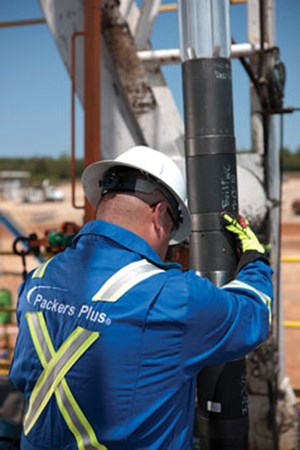
An operator in the Permian used Retina with a 35-stage hybrid system to successfully detect pressure and non-pressure events, such as ball launches for the ball-activated stages and perforation detonation for the plug-and-perf section of the well.
During one of the initial stages, Retina operators observed the ball launch, but did not detect it travelling through the wellhead or landing on the seat. A second ball was launched with the same result. Without wasting further balls or fluid, the launcher was taken apart, and both balls were found trapped at the valve that should have released them to the frac line. After this, all balls were launched manually.
The rest of the completion moved forward, as planned. By using Retina and knowing the exact time that balls were launched from surface, the operator was able to make precise calculations of fluid volumes, as well as for timing of pumps to accurately land the ball on the seat. The monitoring systems enabled the operator to verify 94% of all ball launches, as well as 100% of port shifting, plug setting and perforation detonation operations.
Continued innovation. With longer laterals, more stages, and more proppant and fluid pumped into each stage, along with challenging operating environments, technological advances are required continually to meet completion demands. Combining new technology with a focus on operational efficiency is a key way to improve completions while managing overall well costs, Fig. 1.
REFERENCES
- Genscape, “Growth in Permian production to stress outbound infrastructure in late 2017,” http://www.genscape.com/blog/growth-permian-production-stress-outbound-infrastructure-late-2017, 2017.
- Edwards, J., W. M., et al., “Tight gas multi-stage horizontal completion technology in the Granite Wash,” SPE paper 138445-MS, 2010.
- Wilson, B., et al., “Comparative study of multi-stage cemented liner and openhole system completion technologies in the Montney resource play,” SPE paper 149437-MS, 2011.
- Coiled tubing drilling’s role in the energy transition (March 2024)
- Shale technology: Bayesian variable pressure decline-curve analysis for shale gas wells (March 2024)
- Using data to create new completion efficiencies (February 2024)
- Digital tool kit enhances real-time decision-making to improve drilling efficiency and performance (February 2024)
- E&P outside the U.S. maintains a disciplined pace (February 2024)
- Prices and governmental policies combine to stymie Canadian upstream growth (February 2024)

