U.S. plays role as swing producer, gas production down slightly
The vast number of shale oil operators in the U.S. combined to act as unwilling swing producers during 2016, with the medium-to-small operators scrambling to survive the downturn. Marketed gas production dropped slightly, compared to last year.
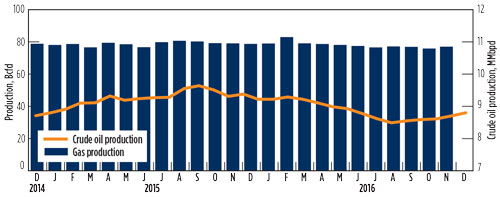
Crude oil. Overall, U.S. crude production decreased 5.7% in 2016, with noticeable declines reported in Texas, North Dakota, California and Kansas. WTI prices started the year fluctuating between $28/bbl and $42/bbl until hitting $45.44 in mid-May. During the first week in October, prices finally stabilized in the $47-$50/bbl range before hitting a yearly high of $53.75 on the last day of December.
In spite of price stability in the second half, U.S. production continued to fall through the third quarter, with daily average oil production dropping to 8.9 MMbpd, compared to 9.4 MMbpd in 2015.
Among the 10 major oil producing states, losers outnumbered gainers. Texas oil production declined 6.2%, dropping to a daily average of 3.5 MMbpd in 2016, due partially to declining drilling activity in the Eagle Ford shale play. Similarly, Bakken production in North Dakota registered an 11.4% output drop, down to 1.05 MMbopd.
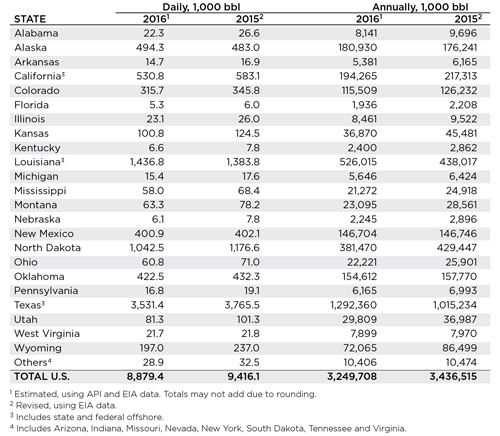
In the Western states, Colorado suffered an 8.7% reduction, and Wyoming was down 16.9%. A catastrophic reduction in drilling activity in California resulted in production dropping to 530,800 bpd, a 9.0% loss. In the Mid-continent, production in Oklahoma was resilient, with activity in the SCOOP/STACK plays limiting losses to just 2.2%, but shale-play-poor Kansas plummeted 19% to average 100,800 bopd. Of the two major states gaining ground, Louisiana and the federal offshore increased 3.8%, up to 1.4 MMbpd, and Alaska upped its output 2.3%, to 494,300 bpd, 11,300 bpd more than averaged in 2015.
Despite the plethora of bad news, an EIA report released in December 2016 shows a dramatic increase in overall efficiency in the U.S. shale plays. The most compelling datum is new-well oil/gas production per rig in the Bakken; Eagle Ford; Niobrara; Permian; and Utica. In the Bakken, one rig can now contribute new output of approximately 1,000 bopd. In 2015, the average was about 500 bopd/well/rig.
Natural gas. Prices for gas during the first half of 2016 traded in the $2.00-$2.25/Mcf range. Prices started an upward trajectory, reaching $3.00 in mid-September before topping out at $3.69 in December. Gas production in 2016 averaged 77.7 Bcfd, 1.8% less than the daily average of 79.1 Bcfd in 2015. ![]()
- Advancing offshore decarbonization through electrification of FPSOs (March 2024)
- Prices and governmental policies combine to stymie Canadian upstream growth (February 2024)
- U.S. producing gas wells increase despite low prices (February 2024)
- U.S. drilling: More of the same expected (February 2024)
- U.S. oil and natural gas production hits record highs (February 2024)
- What's new in production (October 2023)

