Global rig utilization at record low levels, U.S. land activity will rebound in 2017
This year’s NOV Annual Rig Census gave us an opportunity to analyze the composition of the global drilling fleet just as the North American land rig markets began to rebound. Land rig utilization during this census period was historically low, at 22% and 15% for the U.S. and Canada, respectively. Around the world, overall land rig demand continues to drift lower, perhaps showing signs of an inflection point in 2017, as oil prices stabilize.
Offshore rig markets continue to be challenged by low E&P activity as a large number of new-builds are expected to be delivered over the next three years. In response, rig owners have accelerated both the retirement of aged and obsolete assets, as well as the cold-stacking of rigs with lower opportunities of getting work in this competitive environment. For the first time in years, the number of scrapped rigs and new cold-stackings combined, was able to offset the 30 new-builds that the market absorbed in the last 12 months.
The precipitous drop in drilling activity, resulting from two consecutive years of contraction in global E&P spending, has caused thousands of rigs to be sidelined since the end of 2014. While our census methodology keeps all rigs that were active in the past three years as “available supply,” it is possible that a large portion of these displaced units will not return to service, facing competition from newer, more capable rigs.
The available and active rig counts used for the census are calculated every year, during a 45-day period in early summer. This year, that period coincided with the lowest reported land rig counts in North America for any year on our records. A widely available industry report, published on May 27, noted that the total land rig count for the U.S. fell to 374 units, or 80% lower than it was during fourth-quarter 2014. Canadian land drilling demand also found an apparent cyclical bottom at just 34 active units on the day our census period began.
The number of available offshore rigs in the world decreased as a result of rig owners working to retire and mothball idle capacity to offset the 30 new units delivered to the market. Available offshore mobile units totaled 782 rigs, with 473 of those rigs performing work during our 45-day window (60% utilization). This represented a decrease of 144 active rigs year-on-year.
CENSUS HIGHLIGHTS
Key statistics from the 2016 census include the following:
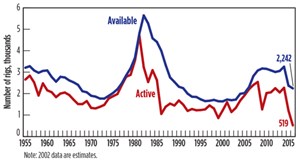
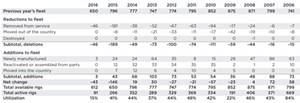
- The U.S. fleet had an overall decline of 188 rigs, causing the total available count to drop about 5% to 2,242 rigs. This net decrease is the result of 240 rig deletions and 52 rig additions, Fig. 1.
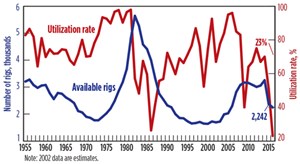
- Utilization of the U.S. fleet (combined land and offshore) declined for the second consecutive year and now stands at 23%, Fig. 2.
- The number of active global offshore mobile units dropped by 29% to 460 units, vs. 647 in the previous census period.
- Overall, international land rig utilization declined eleven percentage points for 2016 and now stands at 70%.
U.S. RIG ATTRITION
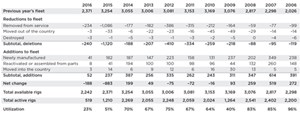
We define an available rig as one that is active or ready to drill without significant capital expenditure. To be considered available, a land unit must not have been stacked for longer than three years; five years for offshore units. If it can be determined that a rig is cold-stacked, then it is removed from the available fleet. Extensively damaged rigs are also taken out of the available count. Rigs that have moved to other countries are not counted as available in the U.S.; however, they may show up in the international tally. All rigs removed from the fleet in each of these cases are totaled as “Deletions to the U.S. Fleet.” There were a total of 240 rig deletions this year, compared with last year’s 1,120 unit decline, and a 10-year average of around 300 deletions per year, Table 1.
The largest number of deleted rigs continues to be in the “Removed from Service” category. This number dropped from 1,086 units in 2014 to 234 units this year, which is closer to the historical average. In the land segment, most of these removals came from rigs being cannibalized to support the operation of other rigs. There were also important cold stacking and scrapping efforts on the offshore side, accounting for roughly half of the 234 removals from service.
We did not see as many rigs moving in and out of the U.S. as we did in 2015, when 33 rigs were exported and 14 imported. In 2016, imports and exports of rigs offset each other at three units. Low oil prices have caused the prospect of moving rigs to other countries to be less attractive, as drilling activity in many other parts of the world also remains low.
Rig accidents occasionally occur, and equipment may sustain irreparable damage. Irreparable rigs are classified as “Destroyed.” Three rigs were classified in this category during this year. This compares with one rig for 2015, and five that were counted as destroyed in the 2014 census.
U.S. RIG ADDITIONS
As the new rig building programs wind down, rig owners continue to put their new supply into the market, especially if a new rig is committed for long-term contract work. In other cases, rig owners have chosen to delay delivery of their new rigs until market conditions improve. This is especially true offshore, causing abnormally low new rig additions compared to historical trends. Census figures show that a total of 52 rigs were added to the fleet over the last year, compared with 237 units in 2015, and 387 units in 2014. These additions were not enough to offset the 240 deletions from the fleet, resulting in a net decrease in the size of the rig fleet for the first time since 2012, Table 1.
The low utilization of the existing U.S. fleet caused the number of new-builds delivered to U.S. drillers to drop more than 70% compared with the 182 new units delivered in 2015. The number of U.S. rigs that were “Reactivated or assembled from parts” continued to drop in 2016. This year’s count came in at only eight units, while 41 units were brought back into service in 2015.
Three rigs that “Moved into the country” are counted as additions, though this was offset by three units that “Moved out of the country.” Therefore, 2016 had zero net imports and exports. This is down from the 14 rigs that moved into the U.S. and 33 that moved out of the country during 2015.
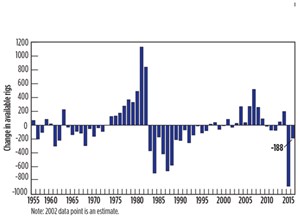
With a total of 52 rig additions and 240 rig deletions, the net change in the fleet over the past year was a 188-unit decline, or 5.4%. This is far less than last year’s historic rig count drop of 883 rigs, caused by the significant shift from natural gas to oil drilling in late 2011, but still represents the second consecutive year of fleet size contraction. This compares to a fleet increase of 199 units in 2014, Fig. 3. The U.S. fleet now has 2,242 available rigs.
CANADIAN FLEET
The Canadian available fleet continued to drop in 2016. The number of rigs removed from service increased as many stacked rigs were taken out of commission. “Newly manufactured” units all but came to a halt, and the data did not indicate many reactivations, given the poor prospects for additional work. Losses outpaced gains, and the available fleet size fell as a result.
Rigs “Removed from service” continue to be the primary cause of Canadian fleet attrition. This includes land rigs idle for more than three years and offshore rigs idle for more than five years, as well as those that might require a considerable capital outlay. There were 46 rigs classified in this category, which were dropped from the census available count. This compares with 181 rigs that were removed from service in 2015.
We could not find clear information regarding the movement of rigs in and out of Canada and there were no Canadian units reported as “Destroyed” over the past year. The sum of all deletions for Canada totaled 46 units in 2016.
The number of “Newly manufactured” rigs entering the Canadian fleet this year was three units, compared with 24 rigs in both 2015 and 2014. Reactivations were also not common during the analysis period, as rig activity was at the cyclical low, averaging 48 rigs for the entire second quarter of 2016. There were three rig additions and 46 deletions this year, which caused the Canadian available count to drop to a new 10-year low of 612 units, Table 2.
GLOBAL OFFSHORE MOBILE FLEET
The combination of ongoing deliveries of new units from backlog into an already oversupplied environment has put tremendous pressure on fleet utilization, which we estimate to be 62% during this census. This is the lowest level observed in the past 16 years. Efforts are being made to adjust rig supply to this new level of demand. Rig owners are postponing delivery of new units, cold-stacking and retiring aged and obsolete assets to reduce their costs.
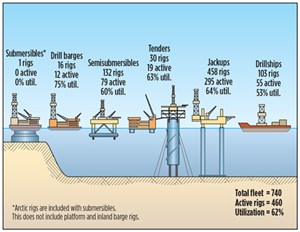
In this census period, a total of 30 rigs entered the fleet, down from 48 units in the previous year and 63 in 2014. There were 50 rigs retired from the fleet this year and an additional 120 rigs put into long-term stacking. Some of these cold-stacked assets will be reactivated when conditions improve, but there will be some that remain sidelined and eventually demolished. In aggregate, the available global offshore drilling fleet saw a net reduction of 151 rigs to yield a total of 740 available rigs, and of these, 460 units were active during the 45-day census period, Table 3. If an offshore rig has not been active in the past five years and does not have a signed contract, it is removed from the available count until those conditions are met. This prevents rigs that cannot be reactivated quickly from being counted.
There were 30 new offshore rigs delivered in the last year, well below the historical average of 40 units observed between 2009 and 2015. The main reason for the reduction in new unit deliveries is that many offshore drillers are choosing to delay their delivery date to reduce their capital requirements and avoid having new assets idle in their fleet.
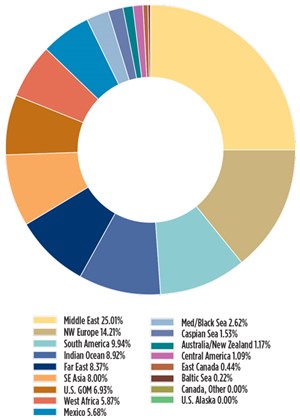
The worldwide offshore mobile fleet is widely distributed with the Middle East, Northwest Europe and South America accounting for 50% of all active rigs during the census period. Active rigs by region, and fleet composition by specific rig type are shown in Fig. 4 and Fig. 5, respectively.
U.S. DRILLING ACTIVITY
Drilling activity in the U.S. continued to decline since the last edition of the census. The number of active rigs tumbled to 519 during the 45-day period, less than half of the number of rigs observed in the early summer of 2015. The methodology used to count active rigs for the NOV rig census is different from other published rig counts. The NOV methodology counts a rig as active if it has drilled at any time during a defined 45-day period in late spring. For 2016, the window of activity was May 6 thru June 19. This is in contrast with the procedure used by other published rig counts, which look at weekly activity. Using a longer observation period ensures we do not miss rigs that are active and in transit from one location to another.
This year, overall U.S. rig utilization fell to an unprecedented 23%, compared with 51% in 2015 and 70% in 2014. According to our records, this is the lowest utilization level in the last 61 years since our census was first published in 1955, with 1986 being the second lowest utilization at 26%. However, the speed at which the rig counts collapsed did not allow adequate time to identify those rigs that are less marketable and that will eventually exit the fleet. This could mean that the number of available rigs is lower than the number calculated by applying our census methodology.
There were 1,723 available rigs in the U.S. that were idle during this year’s census period. Most of these units are waiting for contracts. These inactive rigs were classified according to the length of time they have been idle. Rigs stacked less than one year totaled 766 units; one to two years, 885 units; and two to three years, 75 units.
Full-year utilization is the ratio of active to available rigs that drilled at any time during the past year. This is another statistic used to measure overall fleet dynamics. Adding the 519 active rigs to the 766 rigs stacked less than one year provides the total number of rigs that drilled between the end of the 2015 census and the end of the 2016 census.
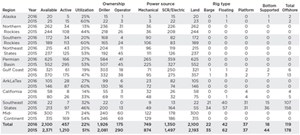
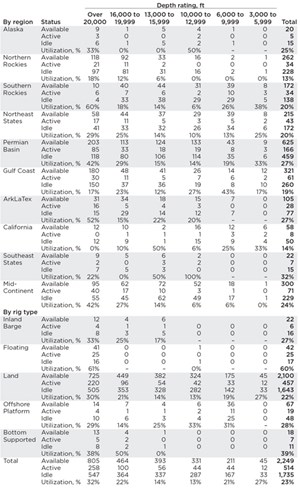
Census results for the U.S. are also calculated by region. All U.S. regions had decreases in both available and active rigs in 2016. The year-to-year breakdown for 2014 and 2015 is shown in Table 4. The regions hit the hardest this year were the Northern Rockies, where utilization fell to 13% and the Gulf Coast, where activity decreased 65% after a loss of 114 active rigs. California also saw a low utilization level of 14%, dropping 22 rigs compared to last year.
The regional figures above are a combination of land and offshore statistics. When studying U.S. land rigs, the 2016 utilization rate declined to 23%, compared to 52% deployed in 2015. The U.S. marine mobile fleet also had a considerable utilization drop in 2016 to just 54% versus 69% last year. Demand for exploration and development offshore rigs by type varied greatly, with jackup rigs having the lowest utilization at 39%, and semi-submersible rigs having the highest utilization of 60%.
By analyzing the U.S. land fleet, we can compare rigs by their drilling depth capacity. The land rigs with the highest utilization rate were the largest rigs, having depth capacity greater than 20,000 ft, at 30% utilization, while the lowest were those in the 10,000 ft to 12,999 ft-range at 13%. This makes sense, since horizontal drilling has dominated activity in the country, and wells with long horizontal departures require bigger rigs that can generate higher-torque and sufficient hoisting capacity to drill these wells efficiently, Table 5.
CANADIAN DRILLING ACTIVITY
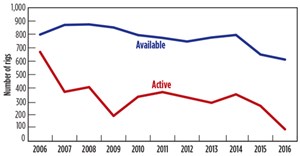
Year-to-year drilling activity in Canada fluctuates with commodity prices and the timing of the spring breakup, when rig moving is restricted in environmentally sensitive areas. During the 2016 census, Canadian rig activity fell 65%. After having surged to 352 active rigs in 2014, the active count was 91 units during the 45-day census window between May 6 to June 19. Since the majority of these rigs became inactive within the last two years and, therefore, are still considered available under census methodology, we find that active utilization in Canada dropped to an extremely low 15%, Fig. 6.
Segmenting the Canadian fleet by depth capacity, 34% of available rigs are rated between 10,000 ft and 13,000 ft, followed by 25% of units between 13,000 ft and 16,000 ft. Utilization by depth capacity indicates that those rigs with ratings 20,000 ft and over have the greatest utilization levels. This is consistent with the proliferation of unconventional oil and gas activity that requires longer horizontal sections, increasing overall measured depth of the well.
INTERNATIONAL LAND RIG UTILIZATION
International utilization is estimated on a regional basis. This year, NOV developed a new methodology to derive more accurate “marketed” utilization in each region. We increased the granularity and frequency of observations, and compared that with information from our representatives in each region. Using the new approach, we estimate 2016 international land rig availability at 3,172 units, of which 2,205 were active during the census period. This results in a global land rig utilization level of 70%, down from our estimated 80% in last year’s census.
The Latin American region had the lowest land rig utilization, with an estimated 41%. In Mexico, lower oil prices forced producers to cut-back on operations in the southern region and focus their investment on the continental shelf and exploration activities. In Colombia, the high cost of production caused the rig count to drop by more than 80%, resulting in excessive idle capacity in the country, where usual activity was in the 40-50 rig range. Argentina also saw its active rig count drop; however, this market is more stable than the rest of the region, posting one of the highest utilization rates in the mid 70%.
In Europe, low activity prevailed, but a relatively low number of rigs in the region kept utilization high at 72%. We estimate Russia provides virtually all of the rig count in the region, and our census puts the country’s land rig utilization close to 80%.
In Africa, land rig utilization was estimated at 53%, having 69 active units and 129 rigs available for the purposes of this census. Algeria, which is fully utilized, and Kenya at 85%, are the strongest in the area in terms of activity. Our estimates for Nigeria point to a 30% utilization of their land fleet.
In Asia, India and China are the top two strongest markets, with Indonesia coming in third. We estimate the Asia-Pacific/China regional utilization at 77%, with a combined 740 active rigs during the census period.
Within the Middle East, the U.A.E. and Qatar are essentially fully employed, with Saudi Arabia running 106 of its 113 available rigs, resulting in a 94% utilization rate. Kuwait utilized 83% of its 53 available rigs in country. However, the region did not show an increase in rig activity as a result of recovering oil prices, Table 6.
GLOBAL OFFSHORE MOBILE ACTIVITY
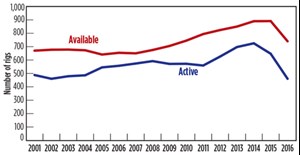
The activity level for the global offshore mobile fleet continued to decline, with 460 rigs active in 2016, which is a decrease of 187 units, or 29%, compared with 2015. After peaking at 725 active rigs during the 2014 census, the number of active rigs has declined 37%, while the available fleet has only shrunk 17% over the same period, leaving many rigs idle in an environment that offers few opportunities for incremental work. As a result, utilization of the fleet dropped from 73% in 2015 to a 15-year record-low of 62% during 2016, Fig. 7.
U.S. INDUSTRY TRENDS
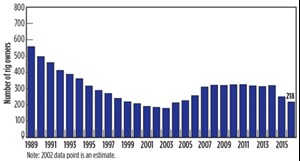
The number of rig owners holding available rigs is also counted. In recent years, the number of owners had somewhat leveled off, with the number of new drilling companies added balancing closely with the number of companies ceasing operations. For 2016, the net number of rig owners declined. Company closures, mergers and acquisitions, and the number of rigs failing to qualify as active in our analysis, all contributed to a net reduction of 32 companies this year. The total number of rig owners is now 218 in 2016 compared with 250 last year. In the 2016 census, the number of land drilling rigs owned by operators fell to 175, or 8% of the available fleet, Fig 8. This is down 115 units from previous year, where operators owned 13% of all available rigs in the country.
In the U.S., there is some indication that the lengthening of lateral sections could lead to the need for larger, more powerful rigs to drill these sections, Fig. 9. While some areas are at the lateral length limit due to land restrictions, other areas will continue to seek longer horizontal sections, which could lead to a new class of land rigs coming to market to satisfy this demand.
U.S. FORECAST FOR 2017
While it would be ambitious to predict the exact effect on the drilling rig fleet for the future, it now looks as if the cyclical demand bottom is behind us. As oil prices stabilize and the historically high levels of oil inventories continue to be worked off, we should see an increasing need for new wells and more rigs being contracted. Some of the most widely distributed forecasts point to a sharp bounce in U.S. drilling, particularly on the land side. However, we should keep in mind that incremental activity will come in an environment of intense competition among drillers, due to the large number of idle rigs that will be battling for work.
The proliferation of unconventional activity over the last decade showed that rigs that are best suited for horizontal drilling in multi-well pads will hold the preference of oil and gas companies. While supply is abundant at current levels, the utilization level of these assets will continue to rise, requiring upgrading or new-building activity to satisfy demand. ![]()
ACKNOWLEDGEMENT
NOV partnered with several companies to collect the industry statistics used in this article. IHS Drilling Data and RigData are the primary sources used for the U.S. land rig fleet and global offshore mobile fleet. Information for some areas, particularly the international fleet, was collected and analyzed by NOV personnel. The following individuals are recognized for their specific contributions to this year’s rig census: Jacoby Garcia (RigData); Diane Henderson (JWN Energy); Jesus Varela, Steve Thompson, Robin Macmillan and Michael Gaines (NOV).
- Applying ultra-deep LWD resistivity technology successfully in a SAGD operation (May 2019)
- Adoption of wireless intelligent completions advances (May 2019)
- Majors double down as takeaway crunch eases (April 2019)
- What’s new in well logging and formation evaluation (April 2019)
- Qualification of a 20,000-psi subsea BOP: A collaborative approach (February 2019)
- ConocoPhillips’ Greg Leveille sees rapid trajectory of technical advancement continuing (February 2019)

