U.S. oil reserves continue to climb for sixth consecutive year

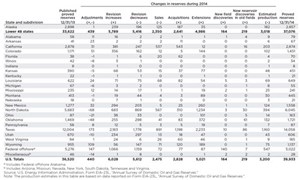
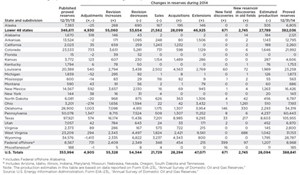
According to the U.S. Energy Information Administration (EIA), U.S. crude oil and lease condensate proved reserves increased for the sixth consecutive year in 2014. At 39.9 Bbbl, reserves increased 9.3% from the year prior, Table 1. This is the first time that proved reserves have exceeded 39 Bbbl since 1972, making 2014 the fourth–highest year on record. Additionally, proved reserves of natural gas reached a record–high for the second consecutive year. A 9.8% boost brought the national total to 388.8 Tcf in 2014, an increase of 34.8 Tcf.
Proved reserves are the EIA’s estimated volumes of hydrocarbon resources that have undergone analysis of geologic and engineering data. These resources are recoverable under existing economic and operating conditions.
Lower prices have curtailed drilling, making recovery economics much more challenging. According to the EIA, sustained low prices for oil and natural gas are anticipated to reduce reserves. Resource estimates are not necessarily reduced by lower prices, however, the calculation of proved reserves is sensitive to price.
Crude oil and lease condensate reserves. Proved reserves of crude oil and lease condensate rose 3.4 Bbbl in 2014, due to an additional 5–Bbbl extension to existing fields. This has been an ongoing trend for the past three years, as the majority of oil reserves tend to be added by extensions to existing fields.
Texas, alone, added 2.1 Bbbl of crude oil and lease condensate proved reserves. Texas Railroad Commission (RRC) District 8, bordering southern New Mexico, added the most oil reserves of all 12 Texas RRC districts, with 0.8 Bbbl. Stacked, tight oil–bearing formations—including the Spraberry, Clearfork, Wolfcamp shale, Strawn sand and Bone Spring formations—were heavily targeted in this district. Additions in the Permian basin accounted for approximately half of the Texas reserves added, and roughly one–third of the net proved reserves additions in the U.S. This is the largest increase of any state in 2014. North Dakota had the second–largest increase, adding 0.4 Bbbl. These reserves were primarily from the Bakken shale play.
Tight oil. As of Dec. 31, 2014, tight oil plays accounted for 33% of all U.S. crude oil and lease condensate proved reserves, 95% of which came from the six major tight oil plays, Table 2. The Bakken/Three Forks play in the Williston basin continues to rank as the largest tight oil play in the U.S., with an increase in proved reserves from 2013 to 2014, swelling from 4.8 Bbbl to almost 6.0 Bbbl.
Natural gas reserves. Once again, proved reserves of natural gas increased 10% in 2014; the same increase seen in 2013. That number has reached a record–high 388.8 Tcf, Table 3. The reserves were added onshore in the Lower 48 states, from ongoing exploration and development in several of the nation’s shale formations, particularly the Marcellus play in Pennsylvania and West Virginia, the Eagle Ford in Texas, the Woodford in Oklahoma, and the Utica in Ohio.

In contrast, there were significant declines in the Rocky Mountain region’s natural gas reserves during 2014. According to the EIA, many operators curtailed development of their mature, dry, natural gas fields in Wyoming and Colorado, to pursue preferential liquids–rich targets in other states.
The share of shale gas compared with total U.S. natural gas proved reserves increased from 45% in 2013, to 51% in 2014. Additionally, estimated production of shale natural gas increased 18%, from 11.4 Tcf to 13.4 Tcf. Pennsylvania’s proved reserves surpassed those of Texas for the first time during 2014.
Operators in Pennsylvania reported the largest net increase in reserves, at about 10.4 Tcf. The increase was driven primarily by continued development of the Marcellus shale. Texas added the second–highest volume of proved gas reserves with 8.0 Tcf, followed by West Virginia with 7.9 Tcf. Holding 5.4 Tcf of proved gas reserves, Oklahoma added the fourth–largest volume in 2014. Ohio claimed the fifth–largest increase, adding almost 4 Tcf. Additionally, operators in Idaho reported natural gas proved reserves for the first time in 2014. ![]()
- The last barrel (February 2024)
- What's new in production (February 2024)
- E&P outside the U.S. maintains a disciplined pace (February 2024)
- Prices and governmental policies combine to stymie Canadian upstream growth (February 2024)
- U.S. operators reduce activity as crude prices plunge (February 2024)
- U.S. producing gas wells increase despite low prices (February 2024)
- Applying ultra-deep LWD resistivity technology successfully in a SAGD operation (May 2019)
- Adoption of wireless intelligent completions advances (May 2019)
- Majors double down as takeaway crunch eases (April 2019)
- What’s new in well logging and formation evaluation (April 2019)
- Qualification of a 20,000-psi subsea BOP: A collaborative approach (February 2019)
- ConocoPhillips’ Greg Leveille sees rapid trajectory of technical advancement continuing (February 2019)


