One for the record books

This year’s financial losses suffered by U.S. producers and service providers have given significant pause to activity. Early this year, when oil prices tanked, operators were quick to slash drilling plans. With breathtaking speed, over just seven weeks, the Baker Hughes Rotary Rig Count plummeted roughly 25%, from 664 units on Jan. 8, to 502 on Feb. 26. Then, over an additional 12 weeks, the count continued to free-fall, losing another 98 rigs, to finally hit its all-time low of 404 on May 20.
The low oil prices and shattered activity have played havoc with the balance sheets of many operators and equipment/service firms. In response, both groups have tried to stop the financial hemorrhaging by conducting personnel layoffs aplenty, as well as selling oil and gas properties. Some firms have gone so far as to close down and/or sell office space and equipment yards, and others have terminated or consolidated leases in office buildings.
In the midst of this chaos, there is a positive development—the financial losses have provided the producer and service sectors an opportunity to expedite specific transformation programs that will enable them to respond, when a sustained price recovery occurs. Yes, the current situation is dire, but the industry also survived a similar bust in 1986-1987, when the price of crude approached single digits. During that down-cycle, U.S. drilling fell 45.4%, from 1985’s total of 71,108 wells to just 38,809 in 1986. Eventually, the industry dug itself out of that trough by utilizing technical innovation of many kinds. We foresee technology, once again, leading the way out of the current downturn.
Nevertheless, in the short term, the U.S. upstream industry rightfully has reasons to be concerned. After flirting with the $50 mark, the WTI futures price as this issue of World Oil went to press was down in the low-to-mid-$40s, muddling around in a narrow range. And operators’ second-quarter reports, while talking about brighter days ahead in 2017, did not provide much optimism for the back half of 2016.
Furthermore, many producers are sitting on their hands, preferring to wait out the results of the U.S. Presidential election in November. Based on comments that we have heard from operators and service companies, alike, producers are afraid to take a chance and formulate an activity strategy based on either Hillary Clinton (Democrat) or Donald Trump (Republican) winning the election. Instead, paralyzed by fear, they have opted to do nothing.
Thus, it is our belief that the U.S. E&P market will endure an historically low level of drilling for 2016, with only 14,430 wells forecast. This is significantly more severe than the 19,179-well total that we originally forecast at the beginning of this year, before the bottom fell out of the rig count. To put this total in perspective, it is only the second year since 1934 in which the U.S. has drilled less than 20,000 wells (in 1999, just 18,039 were drilled). To put it another way, this will be the lowest annual well count since 1933, when only 11,700 wells were drilled. The 2016 forecast total is on a par with that very fallow 1930-1934 period, when not a single year topped out at over 20,000 wells.
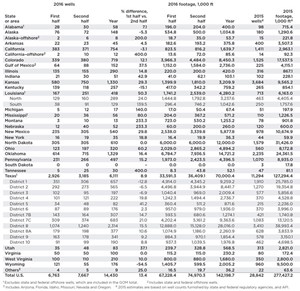
Accordingly, for the remainder of 2016, World Oil’s forecast (Table 1) includes these highlights:
- U.S. drilling will increase 13.4%, from 6,763 wells in first-half 2016, to 7,667 in the second half.
- On a year-to-year basis, U.S. drilling will plummet 50.0%, to 14,430 wells in 2016, from 28,842 in 2015. Our revised total for 2015 drilling is just 150 wells higher than our original figure six months ago, or a difference of just 0.5%.
- The amount of U.S. footage drilled will increase 11.5%, to 74.97 MMft of hole in second-half 2016, from 67.23 MMft in the first half. However, year-on-year, U.S. footage drilled will be down 48.7%, to 142.2 MMft. This figure is down 65% from the nearly 400.0 MMft of hole drilled in 2014.
- Activity in many states is now down to just one-quarter to one-third of where it was at two years ago.
- Most states will see a drilling increase in the second half of 2016.
- Producers, in partnership with service companies, continue to cut costs and wring out more efficiencies, in all phases of their operations.
Capital spending. The summer version of a twice-yearly survey, authored by Evercore’s oil services director, James West, was released June 3 and predicts a dramatic reduction in North American (NAM) capital expenditures. The report forecasts that 2016 NAM budgets will fall 41%, to $87,933 billion from $148,325 billion last year. In the U.S., spending will be down 42%, totaling just $68,679 billion vs. $119,108 billion during 2015. The market-share war instigated by Saudi Arabia has reduced NAM onshore investments, particularly in the U.S. shale plays, leading to lower production. West expects Capex by independent onshore operators to drop 53%, year-on-year. These smaller companies account for 23% and 19% of NAM spending in 2015 and 2016, respectively.
In the shale plays, West expects spending to remain low, as incremental drilling will occur only in the more productive regions first. However, DUC wells in the Bakken may support near-term pressure pumping Capex, and some operators acknowledged increased pressure pumping utilization in the Williston basin.
The oil price rally during first-half 2016 is unlikely to impact activity noticeably in the second half of this year, but it did prevent additional budget cuts. About 37% of NAM respondents said they would increase spending, if prices rise enough to improve project economics. Approximately 17% of companies surveyed by Evercore indicated a $50/bbl price is necessary to stimulate incremental spending, while oil in the $55-60/bbl range is required for 41% of the respondents.
For natural gas, 33% said they would increase 2016 spending, if prices hit $2.50-3.00/Mcf. However, if gas prices climb above $3.00/Mcf, 78% of respondents would increase Capex 10% versus a smaller 53% of respondents to the oil question. This suggests that gas-directed activity may be more elastic to gas prices, compared to oil-directed activity linked to the WTI price.
For 2017, the Capex outlook is more encouraging, with 73% of Evercore’s survey participants expecting to increase spending and only 28% remaining at 2016 levels. None plan to lower Capex next year.
Oil prices. In mid-January, both WTI and Brent dropped below $30/bbl, due partly to a market-share battle between Saudi Arabia and Russia, which pushed production in both countries to record-high levels. Wells in the large U.S. shale plays also proved more resilient than expected, adding to oversupply and downward price pressures. In April, historically low rig activity accelerated declines in U.S. crude output, and prices surged to four-month highs, with WTI sitting at $45/bbl, and Brent trading for $47/bbl. The increases came despite a prediction by the International Energy Agency (IEA) that global oil demand growth would ease to around 1.2 MMbopd in 2016.
Prices continued to climb in May, when falling U.S. production, coupled with supply disruptions in Nigeria, Ghana and Canada, pushed WTI and Brent above $50/bbl. In June, crude markets rallied to $51/bbl. However, concerns about slowing economic growth related to the UK’s decision to exit the European Union, and easing of the supply disruption in Canada, lowered prices in late June/early July.
EIA forecasts that WTI and Brent spot prices will average $41.16/bbl and $41.60/bbl, respectively, for 2016, and hit $51.58/bbl (both crudes) during 2017.
Natural gas prices. The EIA said that the Henry Hub spot price averaged $2.14/MMBtu during second-quarter 2016, up 14 cents/MMBtu from the first quarter’s average. EIA expects average spot prices to increase during the second half to $2.71/MMBtu in the third quarter, and $2.60MMBtu in the fourth quarter. On an annual basis, EIA projects the Henry Hub price to average $2.36MMBtu for 2016 and $2.95MMBtu during 2017.
EIA’s forecast of U.S. natural gas consumption averages 76.5 Bcfd during 2016, increasing to 77.7 Bcfd for 2017. In 2016, the surge in consumption is attributed mainly to increased demand by electric power-generating companies that are exploiting the sustained, low prices.
Oil production. The industry consensus during first-half 2016 was that falling U.S. crude production, caused by record-low drilling activity, would stabilize oil prices and lead to a recovery by year’s end. Although oil prices did increase more than 70% from the 12-year low of January, record-high crude and gasoline inventories continued to put downward pressure on prices. Adding to the slump, a rise in U.S. drilling threatens to swell supplies further, in spite of nine consecutive weeks of drawdowns at Cushing, Okla., which ended during the week of July 18, when inventory levels unexpectedly reversed course.
The EIA predicts average U.S. crude and condensate production will decrease 8.5% in 2016, to 8.6 MMbopd, and by another 4.7% in 2017, down to 8.2 MMbopd. The forecast reflects declining onshore production in the Lower 48, but it is offset partly by increases in the GOM.
Based on the current price forecast, EIA expects U.S. oil production to continue to decline in most onshore regions through mid-2017. However, increases in production are expected in late 2017, based on efficiency gains, lower break-even costs and higher oil prices.
Natural gas production/storage. EIA reported that marketed, natural gas production in June 2016 averaged 79.1 Bcfd, down approximately 1.0 Bcfd from the record-high daily average set last February. EIA predicts that gas production will rise through 2016 and 2017, in response to forecasted price increases and gains in LNG exports. Overall, natural gas output should grow 1.0% in 2016, to 79.5 Bcfd, and increase 2.4% in 2017, with average rates reaching 81.4 Bcfd.
In March, natural gas inventories ended at 2.49 Tcf, the highest end-of-withdrawal session level on record. As of July 1, natural gas inventories stood at 3.18 Tcf. Even with lower-than-average storage injections, EIA forecasts natural gas inventories to be 4.02 Tcf at the end of October, a record.
U.S. rig count. As of July 31, the Baker Hughes U.S. rotary rig count was 463, down 411 units, or 47%, from the 874 figure tallied during the same week of last year. During the first seven months of 2016, the U.S. rig count averaged 483, down 56% from the same period in 2015. The percentage of decline between offshore and onshore activity was similar, with 16 units drilling in the GOM during the week ending July 31, compared to 34 rigs running, one year ago, a decline of 53%.
A year ago, the oil-gas split listed in the Baker Hughes rig count stood at 76% oil, 24% gas, a metric that remained relatively consistent back to Sept. 2012. The split now stands at 81% oil, 19% gas, suggesting that gas prices are not yet able to lure producers away from oil.
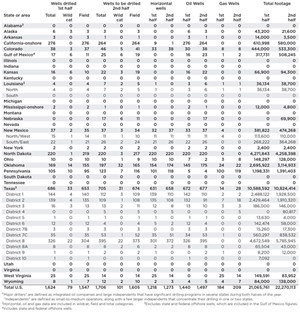
World Oil’s operator surveys. As usual, World Oil conducted its survey of drilling plans by larger operators, as well as small-to-medium independents, Table 2. Accordingly, the U.S. totals for the two groups, combined, show a 5.0% increase in drilling, to 1,706 wells, by these companies for second-half 2016. This is a smaller percentage gain than for the overall U.S. total, reflecting a conservative, cautious mood among the survey group. Indeed, seldom have we seen such drilling discipline among operators.
In quite a few states throughout the U.S., many operators have sworn off drilling completely. For example, even though we surveyed nine firms in Arkansas, they only account for three wells in the first half, and one in the second half. That’s because seven of the nine firms had no activity at all, in either half. Likewise, in Kansas, we had responses from a whopping 17 companies, yet only six of them had activity. So as readers can see, many independents are doing absolutely no drilling this year. Throughout the U.S., we heard from 130 small-to-medium operators, and only 47 (36%) of them had any activity in either the first half or second half of 2016.
Gulf of Mexico. Activity continues to be confined to mostly deepwater parcels and projects, which have longer lead times and need to stay on long-term schedules. In addition, about three-quarters of all drilling in the Gulf is oil-directed. And, as reported by our contributing editor, Mike Slaton, back in the April issue, the long lead times meant that quite a few deepwater development projects began in 2015 and 2016, despite mediocre oil prices. And several existing projects are going onstream, as well. Yet, the picture is looking grim for any new projects to begin in 2017 and 2018, and this, in itself, could delay a reasonable activity recovery in the Gulf.
State-by-state highlights. As the drilling slump unfolded over the last eight months, operators have cautiously focused activity in the most profitable portion of the shale plays. In some states, producers have taken to drilling cheaper, shallower vertical wells (particularly oil), rather than focus on more complex, more expensive projects. So far, natural gas-targeted drilling is not leading the industry to higher activity levels.
Texas. Things certainly have changed in the Lone Star state over the last four years. Back in 2012 and 2013, the Eagle Ford shale was the toast of Texas, and the Permian basin had yet to catch up to its younger cousin. Now, in 2016, much of the Eagle Ford’s equipment, manpower and supplies has been diverted to the Permian. The Permian’s high quality and productivity are hard for operators to ignore, especially when it costs less to drill a top-performing well in that area, as opposed to the Eagle Ford.

A perfect example of operator thinking is EOG Resources, which said that in just the second quarter, alone, it “expanded its premium inventory in all three of its major Delaware basin formations—the Wolfcamp, the Second Bone Spring and the Leonard.” The firm said that in this timeframe, it added more than 500 net, premium drilling locations. And to support its obvious prejudice in favor or the Permian, EOG said that it “continues to improve well economics in the Delaware basin.”
With many operators duplicating EOG’s thinking, the wells drilled total is expected to improve during second-half 2016 in all three Railroad Commission districts that comprise the Permian—Districts 7C (up 21.0%), 8 (up 15.5%) and 8A (up 10.6%). By comparison, the Eagle Ford’s two main districts will both fall further in the second half—District 1 will be down 12.8%, and District 2 will decline 6.5%. Overall, Texas will see drilling improve 8.9%, to 3,185 wells, in second-half 2016. But the annual total of 6,111 wells will still be down 46% from 2015’s level.
Oklahoma seems to be faring better than many states, and the answer may be the superior quality of assets in the STACK and SCOOP plays. Indeed, Continental Resources Chairman and CEO Harold Hamm said in a second-quarter report that his firm “once again outperformed production guidance in the second quarter, thanks to the exceptional quality and performance” its SCOOP and STACK assets. A variety of other firms, including Marathon, Devon and Newfield, seem to agree with Hamm’s assessment and are experiencing similar results.
Meanwhile, Devon reported that it brought online a record-setting oil well. It was drilled with a 5,000-ft lateral and achieved a 30-day average rate of 2,100 Boed, consisting of 1,500 bopd, or 70% of the production mix. Indeed, EIA reported that while most U.S. oil output continued to fall during the first five months of 2016, Oklahoma’s production actually gained 8.3%, averaging 429,000 bpd in May. Statewide, drilling is expected to increase 16.4% during second-half 2016, and World Oil’s operator survey confirms this finding. The survey group represents about 28% of the state’s activity.
Louisiana. Some of the larger operators that were present in Louisiana in past years have either curtailed drilling in the state or suspended activity altogether. Smaller producers are making up some of the difference, although drilling for the year, overall, will be down about 41% from 2015’s level. In fact, the state’s Office of Conservation (OOC) told World Oil that it expects a 24% activity increase in Louisiana’s northern half. OOC also predicts a significant drilling increase in the state’s southern half, where activity had nearly dried up. In the southern parishes, OOC expects wells targeting oil to outnumber gas-directed activity by two to one. On the other hand, in northern Louisiana, gas-targeted wells will constitute 60% of drilling.
North Dakota gained notoriety in the spring of 2014 by becoming the only state, other than Texas, to produce more than 1.0 MMbopd. The state hit a peak output of 1.23 MMbopd in December 2014 before reduced drilling caused production to begin to decline. Still, the decline has been gradual, and as of May 2016, output was down only 15%, at 1.044 MMbopd. This is despite the fact that drilling fell nearly 35% in 2015, and will drop another 61% this year. The production performance is a testimonial to the great IPs and extended stamina of many Bakken shale wells, not to mention that many operators are drilling strictly the sweetest spots.
Our forecast, based on data from the state’s Department of Mineral Resources, is for drilling to remain flat for second-half 2016, at 305 wells. This outlook is supported by our operator survey, which shows virtually no difference between the two halves of the year. Our survey group represents 59% to 62% of anticipated activity.
In the Northeast, where exploitation of the Marcellus and Utica shales propelled activity to record highs across the region in the 2010-2014 period, drilling has cooled considerably. Some operators have reduced drilling and concentrated their work on completing their backlogs of DUCs. Indeed, CONSOL Energy at the beginning of the year had said that it would not conduct any drilling, except for maybe several deep Utica tests. Yet, in late July, CONSOL said that due to improved oil prices, it would begin a gradual return to drilling, by placing one rig, each, in Washington County, Pa., and Monroe County, Ohio. Ten wells are planned for drilling before the end of the year. Likewise, Southwestern Energy stated that it would resume drilling with five rigs.
Overall, Pennsylvania’s drilling will increase 15.2% during the back half of 2016, although the yearly total of 497 will be down 54% from 2015’s level. Similarly, and more dramatically, Ohio’s drilling will jump 60.2% higher in second-half 2016. However, the state’s yearly total of 320 wells will be down 43% from 2015’s figure. Gas-directed drilling in Ohio accounts for less than 5% of activity, at present.
In the Rockies, the slowdown continues in the Niobrara shale, as well as the Piceance and San Juan basins. And the malaise extends to all regional plays. Particularly hard-hit are Wyoming, Montana and Utah, where the combined decline will see an 80% drop to just 272 wells for the year, compared to 1,351 last year. The situation is less dire in Colorado and New Mexico, where drilling increases are expected for second-half 2016. However, much of New Mexico’s improvement will be confined to the Permian basin in the state’s southeastern corner.
Out west, California is in nothing short of a depression, as activity was down 56% in 2015, and it is slated to fall another 47% this year. This means that the 2016 total will be just 23% of 2014’s level. One would think that with many of opportunities to drill relatively cheap, shallow, conventional oil wells, that California’s activity would hold up better. But add in the costs of secondary and enhanced recovery, as well as excessive regulation, and the picture changes. Indeed, given the low oil prices of earlier this year, California Resources Corporation announced that it would take a hiatus from drilling in the state during 2016.
Finally, in Alaska, as the distractions from Shell’s suspended program in the Arctic are finally ceasing, activity has returned to a more traditional pattern on the North Slope and in the Cook Inlet. And, Alaskan drilling levels are holding up better than elsewhere. In 2015, the onshore drilling total was actually up five wells, at 180, compared to 2014’s figure. This year, the expected total of 148 wells is down just 18%. ![]()


