Accurate modeling improves early production predictions
For years, oilfield service companies have been claiming the ability to predict unconventional well production using reservoir models. The claim is true; they can predict production—just not very accurately. And operators know it.
“All companies have a reservoir model; but oftentimes they are not very reliable at predicting detailed production,” Casey Lipp, a geologist at Peregrine Petroleum, said. The main reason for this unreliability is the inability of the models to simulate fractures. Current models assume that all fractures along a wellbore are planar and simple, with the same height, length and permeability. Using these simple fracture models in a reservoir simulation multiplies inaccuracies.
“When Peregrine began working with MicroSeismic, we became very interested in the addition of adding microseismically derived fractures into the reservoir model. By incorporating precise fracture data, it appears to have achieved a meaningful leap in the ability to accurately predict production,” said Lipp.
MODEL VARIABLES
In the early days of microseismic monitoring and hydraulic fracturing, the approach to quantifying the stimulated reservoir was very simple. Since a microseismic event represents rock failure, it was assumed that a measurement of stimulated rock volume (SRV) would represent the total impact that hydraulic fracturing had had on the reservoir. However, this concept of SRV ignored the variability of proppant placement and the reality that proppant is not placed in every fracture, meaning that not all fractures contribute to production. Therefore, the early models failed to find a useful correlation between SRV and cumulative production over time.
MicroSeismic’s concept of productive stimulated rock volume (P-SRV) is able to account for these variables, by differentiating between proppant-filled vs. un-propped fractures. P-SRV has shown a much closer correlation to cumulative production than was ever achieved with total SRV. This means engineers are able to define which portion of the stimulated fracture network will be productive.
The service company has answered the question “Where is the proppant?” But the most important question that an operator should be asking is, “How much permeability enhancement has been achieved within that P-SRV?” When operators hydraulically fracture a reservoir, the basic goal is to enhance the permeability of the reservoir, by inducing new fractures and activating the existing open natural fractures. Production is ultimately determined by the effective permeability enhancement achieved within the P-SRV.
The process for building a deterministic, discrete fracture network (DFN) model, to determine proppant distribution and induced permeability enhancement, is as follows:
- A fracture plane is defined for every microseismic event that is considered to be associated with hydraulic fractures. The event’s magnitude indicates the fracture size (i.e., area), and the event’s focal mechanism indicates the fracture plane orientation.
- The distribution of proppant throughout the fractures is determined, using a mass balance approach to distribute the actual amount of proppant pumped, starting at the wellbore and moving outward until all the proppant for that stage has been distributed.
- Once the total DFN and propped DFN have been defined, a geocellular grid is superimposed on the DFN to obtain the SRV and P-SRV, capturing the proppant-filled rock volume.
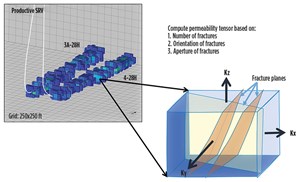
One key advantage of this workflow is the ability to capture the fracture intensity (fracture number, orientation and aperture) achieved in each cell of the geocellular volume, which enables quantification of the permeability enhancement in each cell. Figure 1 shows an example of the P-SRV with the permeability enhancement calculation process for one geocell.
This information fundamentally changes the resulting reservoir model, because the model is now based on a deterministic DFN model, incorporating actual changes in the fracture intensity along the wellbore, rather than using a theoretical fracture model. The deterministic DFN accurately captures variations in fracture geometry and intensity over the entire length of the wellbore, whereas past reservoir models could only use a fracture model that assumed every fracture along the wellbore was the same simple fracture.
HISTORY MATCHING
Modeling an unconventional reservoir presents more challenges than modeling a conventional reservoir. Using production data from an already-produced well to history-match and calibrate unconventional reservoir models is nothing new. Models derived from a rate transient analysis, or decline curve analysis, can usually predict a fairly accurate, estimated ultimate recovery for a completed well, but they have a poor track record for accurately predicting production over increments of time, meaning that they cannot accurately predict how the reservoir will drain over time, as the well continues to be produced.
Quantifying reservoir drainage is where the deterministic DFN gains the most advantage over past theoretical DFNs. The reservoir model is now able to incorporate the comparative permeability values from the DFN, along with the other typical model variables, such as microseismic data, pressure-volume-temperature data, and core and petro-physical data from well logs.
The permeability enhancement results taken from the DFN are actually values of each geocell’s comparative permeability, which represents the mathematical relationship of permeabilities between the geocells within the DFN. The ability to quantify these comparative permeabilities is already an enormous advantage for a reservoir model, because the values show which cells will be more productive. But the real value is in finding the absolute permeability—getting an actual permeability number in milliDarcy. To calibrate from comparative permeability values to absolute permeability values, history-matching of existing production data from a single well is used.
A permeability scalar mathematically captures the ratio/relationship of the comparative permeability enhancement between neighboring geocells. History-matching past production and pressure data to the simulated production and pressures, the permeability scalar ratio scales the comparative permeability values to absolute permeability. The resulting mathematical multiplier/scale is recorded. That same multiplier can be applied to multiple nearby wells’ microseismic data, to produce absolute permeability values.
This process enables reservoir models to be calibrated precisely to the state of the reservoir, based on mathematically-derived data, rather than calibrating based on theoretical assumptions. The result is a reservoir model that is calibrated so accurately, it can dependably predict short- and long-term production and reservoir drainage for multiple nearby monitored wells, using the same absolute permeability multiplier that was already determined during history-matching.
USES
Reservoir models that incorporate these deterministic DFNs and permeability values enable an operator to see how the reservoir is expected to drain, as each nearby well is produced. Understanding the reservoir drainage pattern of each well can prevent incorrect spacing of wells, which results in wells competing for the same drainage volume (if spaced too close together) or leaves significant volumes of rock undrained (if spaced too far apart).
Predicting accurate reservoir drainage patterns also enables the optimization of other variables of field development—such as stage spacing, clustering, or refracturing—to maximize net present value. Production timelines or economic thresholds can be used to constrain long- or short-term field plans, depending upon whether the operator wants to maximize short-term production or wait for the long term. These decisions are often based on prevailing economic conditions.
Quantifying the absolute permeability of each geocell in the reservoir also enables quantification of the productivity of each cell. This could indicate reservoir sweet spots and measure the success of treatment methods for different stages. Stages that are predicted to be less productive can be used to indicate improvements for future treatments, without waiting for the well’s production data to come in.
After processing the production data from one nearby produced well, reservoir models for subsequent monitored wells are available nearly immediately. The same absolute permeability multiplier calibration tool can be plugged into each well’s microseismic data immediately to predict production for multiple, nearby unproduced wells, rather than waiting for each well’s production data to calibrate each model. Operators would typically have to wait at least six months to gather enough production data for each well’s separate model calibration. Eliminating this wait time enables an operator to assess the expected production for multiple area wells, and use that information to plan ahead for future development. It also negates the workflow and time that would typically be required to calibrate each reservoir model.
OKLAHOMA CASE STUDY
In 2014, Peregrine Petroleum was rapidly drilling and completing wells in Ellis County, Okla., targeting the Cleveland formation. In this area, the incised, valley-filled depositional environment makes for highly variable geology, and poses challenges in determining optimum treatment design and well spacing.
Peregrine worked with MicroSeismic to help them quantify fracture geometry and help improve well spacing, stage length, and completions parameters. Peregrine asked the service company to use their new deterministic reservoir modeling method to prove that the model could accurately predict production from a monitored well (i.e., Well B), if the operator provided production information from one nearby, already-produced sample well (i.e., Well A).
Wells A and B were drilled in the early Missourian Cleveland formation, which produces natural gas and oil at around 9,200 ft, TVD. The regional geological structure is a homoclinal dip to the south with a few subtle structures. The project area reservoir is interpreted as being dominated by low-permeability tidal-shelf and distal delta-front deposits. These lenticular sand bodies make it difficult to predict the size and distribution of the reservoir and, therefore, the potential per-well reserves.
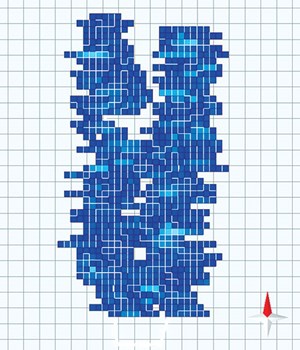
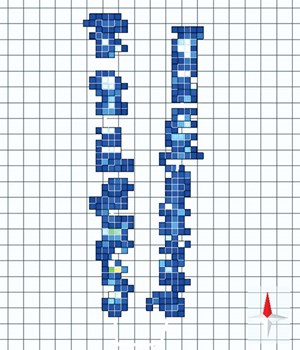
With a temporary surface array, the service company captured data on 20 stages. Peregrine provided surface pressure and production information for Well A. Using the microseismic and client-provided data, the service company determined the total SRV, the portion of the SRV that was propped, and, therefore, the portion that should be productive, in the long term, for both wells A and B, Figs. 2 and 3.
The service company quantified the comparative permeability of the reservoir using a 3D geocellular grid. The necessary scaling factors were obtained from Well A’s production and treatment data and used to translate the comparative permeability to absolute permeability. The resulting absolute permeability multiplier was applied to Well B’s surface microseismic data to predict production and reservoir drainage patterns for both wells A and B. These simulations provided a mechanism to determine the optimal wellbore spacing.
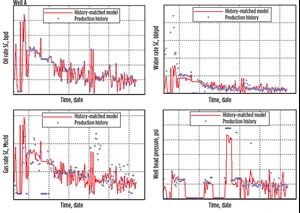
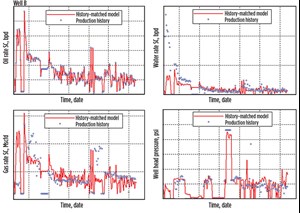
When Peregrine compared Well B’s actual production to the service company’s predicted production, the prediction was shown to be a very accurate match, Fig. 4. This shows that the calibration tools that the service company developed for Well B also can be used now to reliably predict future production and reservoir drainage for other nearby monitored wells.
The service company recommended that Peregrine decrease spacing between wells to approximately 700 ft, to ensure that valuable hydrocarbons are not left unproduced. The company also identified excessive SRV overlap between stages, meaning that Peregrine could fracture fewer stages while still stimulating the same volume of rock. The microseismic analysis suggested that 16 stages would achieve the same SRV as the 20-stage design.
Well spacing in this area of the Cleveland formation traditionally ranges from two to four wells per section or approximately 2,640 ft to 1,320 ft, respectively. Using microseismic data and reservoir drainage estimates provided by the service company, Peregrine implemented a down-spacing pilot project at 1,000-ft spacing and modified treatments to try to increase fracture half-lengths. The pilot wells are on flowback and are being monitored for results. Peregrine plans to continue testing different well spacing distances and fracture treatment designs, to continue to maximize reserve recovery.
CONCLUSION
As discussed initially, everyone has a model; but operators don’t trust it for detailed production prediction, because the industry has learned how unreliable reservoir models can be. The difference in PermIndex reservoir models is that they are able to incorporate a reservoir’s permeability after hydraulic fracturing; therefore, they have the unique advantage of capturing details of the reservoir’s reaction to stimulation. This makes them fundamentally different from previous models. The added level of detail makes the models more deterministic and accurate, and MicroSeismic is gathering further confirmation by working with operators to increase the PermIndex knowledge base. ![]()
- Shale technology: Bayesian variable pressure decline-curve analysis for shale gas wells (March 2024)
- What's new in production (February 2024)
- Prices and governmental policies combine to stymie Canadian upstream growth (February 2024)
- U.S. operators reduce activity as crude prices plunge (February 2024)
- U.S. producing gas wells increase despite low prices (February 2024)
- U.S. drilling: More of the same expected (February 2024)

