 |
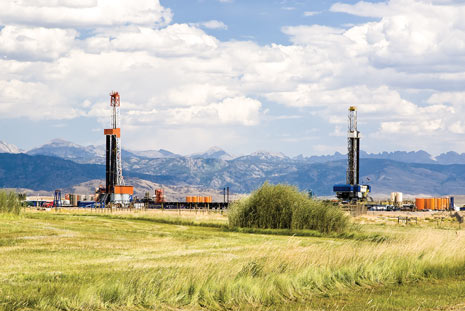
| Operators today are using advanced LWD technologies for more accurate well placement and optimization of fracture programs. |
|
In recent years, the evolution of logging while drilling (LWD) has provided advancements in the way that unconventional reservoirs are evaluated to optimize completion designs. Although unconventional reservoir drilling operations are focused mainly on lateral placement and time versus depth to decrease drilling costs, a shift to a formation evaluation approach is being seen across the industry. The variability along lateral sections of a well presents a challenge to completions operations, as production depends on the quality of the reservoir rock. Logging lateral wells with traditional gamma ray MWD and LWD tools will help geosteer the wellbore in the “target zone.” However, the variability of the target zone’s petrophysical and geomechanical properties, from the heel to toe, is a subject that involves running high-technology LWD tools to provide additional parameters for an optimized fracture design.
While total organic content (TOC) measurements along the lateral can be acquired through cuttings analysis, it is not a continuous measurement. It can have problems, when a high rate of penetration (ROP) is achieved while drilling. Recent technological advancements in spectral gamma ray LWD tools have shown that the direct measurement of uranium can be a proxy for the levels of TOC in the reservoir. In addition, levels of potassium and thorium are also indicators of the brittleness of the rock, due to the clay present, Fig. 1. Not only can these measurements of radio-isotopic minerals help with a post-well petrophysical analysis, they can also be used in realtime for geosteering the wellbore into the “sweet spot” of a hydrocarbon-rich, low-clay zone.
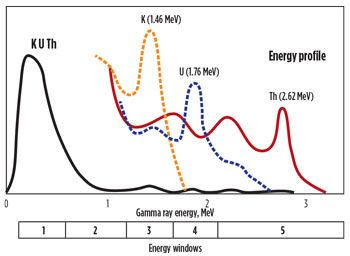 |
| Fig. 1. Levels of potassium, thorium and uranium energy. |
|
Since the spectral gamma ray tool’s ability to measure changes in clay content is a qualitative measurement, the optimized completion design relies on acoustic measurements for a direct, accurate computation of the rock properties. With a LWD sonic tool’s capability to measure the compressional and shear slowness of the rock in real time, geomechanical rock properties can be calculated to determine factors that affect fracture propagation. Although this can be done with a majority of LWD sonic tools, there have been recent breakthroughs on the azimuthal benefits of measuring the shear slowness in the fast and slow directions. An LWD sonic tool, rotating continuously while drilling, can azimuthally bin the semblance into 16 sectors, recording 16 compressional and 16 shear arrivals, along the entire lateral section. When the direction of fast and slow shear arrivals is distinguished, anisotropy can be accounted for and corrected in the rock properties calculations, Fig. 2.
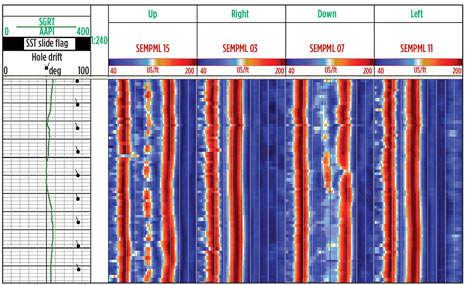 |
| Fig. 2. Azimuthal quadrants sonic measurement. |
|
Evaluating unconventional reservoirs to maximize production has been limited in recent years to a basic interpretation of seismic, gamma ray, and cuttings analysis (SRA, XRD or XRF). These methods have led to variability in production from well to well, which cannot be explained properly with the limited amount of data processed while drilling. By using spectral gamma ray and azimuthal sonic LWD technologies, a balanced approach of petrophysical and geomechanical interpretations can help build an optimized completion model, which specifically stimulates the reservoir’s common fracture gradients, to reduce pumping time and increase the amount of proppant placed during stimulation operations.
EAGLE FORD BACKGROUND
Ever since the advent of horizontal drilling in, and fracture stimulation of, shale plays in the Barnett shale, there have been numerous new plays discovered across the U.S., targeted for their hydrocarbon production potential. These plays are continuous over extremely large areas, and are well-mapped, due to the history of drilling and logging of conventional reservoirs nearby. The Eagle Ford is one of the most prolific producers of shale oil and gas, and it is found in the mature Texas Gulf Coast basin. The Austin Chalk, a clean limestone formation found stratigraphically above the Eagle Ford shale, was targeted decades ago by horizontal drillers chasing hydrocarbon-filled open fractures. It is widely believed that the Eagle Ford was the source rock for this reservoir, due to its logging responses of high resistivity and hydrocarbon indicators.
The Eagle Ford shale has three distinct hydrocarbon windows of oil, wet gas/condensate and dry gas, which are related directly to depth and level of maturity. As one moves toward the Gulf of Mexico coastline, the depth of the formation increases, along with its level of maturity and lack of hydrocarbon liquids. As most drillers are now focusing on the play’s wet gas and oil window, the production of oil in recent years has been rising dramatically. The possibility of drilling a dry hole has been virtually eliminated, although the cost of drilling has risen steadily. While drillers examine how to reduce associated drilling costs, formation evaluation programs have been sacrificed to drill more wells in a limited time frame. This mindset has led to a decrease in time versus depth per well, but an increase in production variability in wells drilled relatively close to each other.
A closer look at the Eagle Ford shale’s mineralogy shows a more carbonate-rich formation, that has favorable geomechanical properties for fracturing operations. The formation also can be divided into an upper, middle and lower Eagle Ford, with varying TOC and clay contents. Depending on the location of the well, drillers target the zones with high TOC and high brittleness, to achieve the best hydrocarbon production by efficiently propping hydraulic fractures open to increase the tight permeability typically associated with shales. In recent years, geometric stage lengths have been the standard procedure in completion operations. However, there are data that show if reservoir rock is grouped with similar rock properties in the same stage, it will result in a better stimulation operation.1 By optimizing the length of the stages and placement of the clusters, a completion program will avoid spending time trying to open hydraulic fractures in ductile, clay-rich zones of the target. This savings in cost during completion offsets the additional logging costs to fully evaluate and interpret the lateral section.
GEOMECHANICAL CONSIDERATIONS
Rock mechanical properties characterization in organic shale formations requires accounting for the intrinsic rock anisotropy. A considerable number of organic shale plays can be characterized as transverse isotropic (TI), due to their inherent layering. Then, in formations with horizontal laminations and no considerable dip, the assumption of a transversely isotropic medium, with a vertical axis of symmetry (VTI), is valid in most of the cases.2
To characterize an arbitrary material by using acoustic measurements, Hook’s Law is used to relate the stress tensor to the stiffness and strain tensors, Equation 1. The definition of the stress tensor for an orthotropic material is shown in the following matrix.3
 (1) (1)
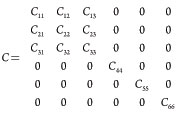
Considering as negligible, the effect of other sources of anisotropy, a VTI medium can be characterized by five independent parameters:
 (2) (2)
Also, by symmetry,
 (3) (3)
Three of these elastic constants can be obtained directly by using high-technology acoustic tools in horizontal wells: C11, C44 and C66.
 (4) (4)
Where Vph is the horizontally propagating P-wave, Vsf is the horizontally polarized S-wave, Vss is the vertically polarized S-wave, and ρ is density.
Figure 3 shows the shear velocities, polarized parallel and perpendicular to the laminations that are required measurements for the analysis in horizontal wells.
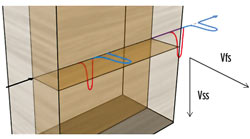 |
| Fig. 3. Vfs required for C66 calculation; Vss required for C44 calculation. Vph propagates parallel to the laminations and is used for C11 calculation. |
|
Assuming Thomsen δ parameter is close to zero, and also considering C12 and C13 are equal for many shales (Walsh et. al, 2007):
 (5) (5)
Using the methodology above, the missing parameters, C33 and C13, can be obtained. Then, elastic moduli in the horizontal and vertical directions, with respect to the laminations, can be calculated:
 (6) (6)
Also, calculations for closure stress gradient are then performed, including the formation anisotropy effect.
 (7) (7)
Where
σh = Minimum horizontal stress
σv = Vertical stress
α = Biot’s coefficient
Pp = Pore pressure
εh = Minimum horizontal strain
εH = Maximum horizontal strain
The methodology above allows the quantification of intrinsic anisotropy along the lateral section. After this, variations in rock mechanical properties can be identified, helping to improve the selection of hydraulic fracturing stages.
Calculation of brittleness was done using the Elastic Moduli approach, one commonly accepted methodology in the industry.4 Values of Young’s modulus and Poisson ratio are normalized, with respect to the maximum and minimum values, and brittle zones correspond to the areas where Young’s modulus is high, and Poisson’s ratio is low:
 (8) (8)
Parameters, such as unconfined compressive strength or friction angle, could also be used to determine the quality of the rock regarding hydraulic fracturing propagation and efficiency. The best approach will depend on the available information and its reliability.
GEOMECHANICS RESULTS
Figure 4 shows the geomechanics parameters, in separate tracks, calculated for an example well. Track 3 shows consistent shear anisotropy through the lateral section, varying from 5-20%; then calculations including isotropic and anisotropic closure stress were included in this analysis.
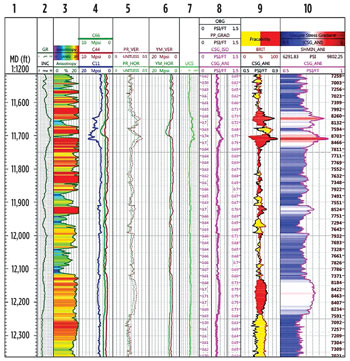 |
| Fig. 4. Final geomechanics evaluation. |
|
Track 4 shows the calculations of elastic constants C11, C44 and C66. The horizontally polarized shear velocity was obtained from bin 4, the vertically polarized shear wave was obtained from bin 0, and the compressional velocity corresponds to the average of the 16 recorded bins. Tracks 5 and 6 show the Young’s modulus and Poisson’s ratio in the horizontal and vertical directions with respect to the laminations. The UCS calculation, shown in Track 7, corresponds to Chang’s empirical equation for shale formations.5
Track 8 shows the difference between closure stress gradient, using the standard isotropic approach, and the anisotropy measurements. The overburden gradient was assumed as 1.0 psi/ft, with a normal pore pressure of 0.44 psi/ft for the lateral section. The results show a significant difference in the two calculations; discrepancies of 0.05 psi/ft between the calculations of closure stress gradient can represent a change of 500 psi in the calculation of the absolute closure stress at this depth.
Track 9 shows the brittleness calculation, using the elastic moduli approach from equation 8 and the closure stress gradient from the anisotropic approach. Yellow shading indicates the areas with better properties for fracture growth and efficiency; this corresponds to high brittleness (high Young’s modulus and low Poisson ratio), and low closure stress. Red shading indicates zones with relatively poor properties that would likely require an improvement in the fracturing design to reach the same efficiency as in other areas.
Track 10 shows the absolute values for closure stress along the lateral section; red zones indicate areas with particularly high values of closure stress. Differences could reach up to 1,000 psi in some areas; these changes in properties can affect, considerably, the final efficiency of hydraulic fracturing operations in some areas when not treated properly.
RESERVOIR QUALITY EVALUATION
By combining the capabilities of the new generation of LWD tools with additional sources of formation characterization, such as core evaluation as principal reference or cutting evaluation (XRD/XRF characterization), the evaluation of sweet spots can be improved significantly. The right evaluation can significantly mitigate the production variability, while optimizing the associated costs of the completion design.
When considering different evaluation types in unconventional resources, the first—and probably the most important—parameter to identify and correlate is the TOC.
Common features in organic shale are kerogen content, pyrite presence, low porosity and permeability, clay content (30%–60%), silt, carbonates and other minor mineral content.
During the execution of the petrophysical evaluation, the integration and correlation of core data is one of the most critical inputs to establish the correct characterization implemented during project development. The pyrolysis evaluation of the core generates the parameters needed to perform the interpretation. The free hydrocarbon (S1) is determined from an isothermal heating process, as well as the maximum rate of hydrocarbon generation (S2) while CO2 is referred to as S3.
Critical inputs to the petrophysical interpretation should be taken into account:
- Level of maturity—process of the conversion from kerogen to gas and oil
- Vitrinite reflectance—The reflection of a beam of light on a particle of vitrinite that is detected in a photo-multiplier and recorded as a percentage
- The TOC could be estimated and related to the volume of kerogen, which, being light and a neutron moderator, has considerable impact on the lithology determination and porosity estimation, Fig. 5.
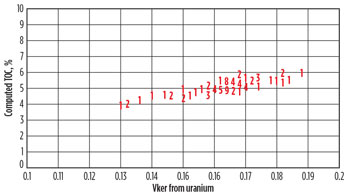 |
| Fig. 5. TOC versus kerogen volume from uranium. |
|
The final output of the evaluation shows the scope of the petrophysical evaluation, Fig. 6:
- Track 1—Volumetric, or lithology identification. In this case, the Eagle Ford formation is a combined carbonate and shale composition.
- Track 2—The TOC calculation can be performed, using the uranium measurement from the spectral gamma ray tool, as well as multiple other measurements, Table 1.
- Tracks 3 and 4—the associated water saturation and permeability evaluation.
- Track 5—Gamma ray and tadpoles in a horizontal well.
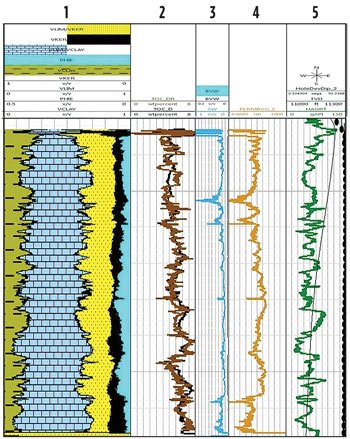 |
| Fig. 6. Final petrophysical evaluation. |
|
| Table 1. TOC calculation can be performed in multiple measurements. |
|

|
In addition to the individual petrophysical and geomechanical properties inherent in the formation, there are two principal factors to evaluate and optimize during stage placement and hydraulic fracturing operations. The first one is the property’s variability along the lateral sections—the standard approach is to assume the formation will behave in a homogeneous manner away from the pilot hole. These evaluations reflect the variations in the mechanical properties, as well as the reservoir conditions. Therefore, this property variation will guide the completion operation, with the mean goal to optimize the frac operation and maximize the efficiency of the simulation process.
The second factor is the intrinsic anisotropy attribute of the shale formation. Due to the deposition generation, it is a laminated formation, causing a variation on the mechanical properties measured vertically and horizontally. Therefore, the rock mechanics evaluation should consider this phenomenon to optimize the hydraulic fracturing operation.
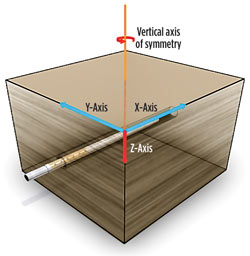 |
| Fig. 7. Azimuthal slowness tools can solve TIH anisotropy in shale formation and enhance rock mechanics understanding. |
|
STAGE PLACEMENT EVALUATION: FINAL INTEGRATION
Historically, in the unconventional industry, completion designs have been evolving from larger stages to smaller stages. With this, the opportunity to group similar properties has increased statistically, as recent studies have shown how engineered completion designs are increasing the productivity of wells. Integration of the reservoir quality and rock quality evaluations will mitigate the uncertainty of the well productivity windows variation, through the total number of attributes to select the stage placement, Fig. 8.
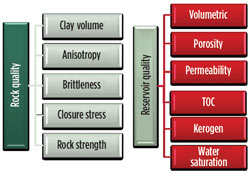 |
| Fig. 8. Attributes to evaluate the stage placement. |
|
The final stage placement is performed by grouping similar attributes of the formation stage by stage; the objective is to treat like rock with rock to optimize the hydraulic fracturing operation, Fig. 9.
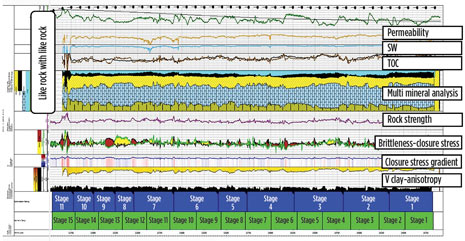 |
| Fig. 9. Final geomechanical and petrophysical composite and optimized completion design. |
|
The green color coding stage placement represents the standard geometric completion design, and the blue coding stage placement shows the optimized design, using multiple attributes from the geomechanical and petrophysical evaluation.
CONCLUSIONS
Optimizing completion operations, by combining petrophysical and geomechanical analysis, will reduce uncertaintities of production variability. The goal of performing this advanced analysis, from well to well, is to explain why each stage is producing differently, and to optimize the design of stages and cluster placement on future wells. This can lead to an increase in production, while lowering pumping time during fracturing operations, and increasing the amount of proppant placed. Understanding the variability of the lateral sections of unconventional reservoirs can provide valuable insight into reserve estimates and effectively demonstrate the need for the industry to switch from geometric stage and cluster placement to an optimized completion design that ultimately stimulates the “like rock with like rock.” 
ACKNOWLEDGEMENTS
We would like to acknowledge the efforts of the Petroleum Consulting and R&D staff at Weatherford.
REFERENCES
- Walker, K., K. Wutherich, I. Terry, J. Shreves and J. Caplan. “Improving production in the Marcellus shale using an engineered completion design: A case study,” SPE paper 159666, 2012.
- Walsh, J., B. Sinha, T. Plona, et al., “Derivation of anisotropy parameters in a shale using borehole sonic data,” SEG Annual Meeting, 2007.
- Waters, G. A., R. E. Lewis, D. C. Bentley, “The effect of mechanical properties anisotropy in the generation of hydraulic fractures in organic shales,” SPE paper 146776, 2011.
- Rickman, R. M. Mullen, E. Petre, B. Grieser and D. Kundert, “A practical use of shale petrophysics for stimulation design optimization: All shale plays are not close of Barnett shale,” SPE paper 11528, 2008.
- Chang, C., M. Zoback and A. Khaskar, “Empirical relations between rock strength and physical properties in sedimentary rocks,” Journal of Petroleum Science and Engineering, vol. 51, P.p. 223-237, 2006.
|


 (1)
(1)
 (2)
(2) (3)
(3) (4)
(4)
 (5)
(5) (6)
(6) (7)
(7) (8)
(8)


