U.S. oil reserves rise for fifth consecutive year
According to the U.S. Energy Information Administration (EIA), U.S. crude oil and condensate proved reserves increased for the fifth consecutive year, in 2013, up 3.1 Bbbl to 36.5 Bbbl. Proved reserves of natural gas set a record, increasing 31.3 Tcf to 354 Tcf.
Proved reserves are the EIA’s estimated volumes of hydrocarbon resources that have undergone analysis of geologic and engineering data. These resources, with an assumed 90% or better probability, can be produced economically and operationally.
Given the economic conditions in 2013, when E&P development was driven by $100/bbl oil, the substantial growth proved to be historical, exceeding 36 Bbbl for the first time since 1975.
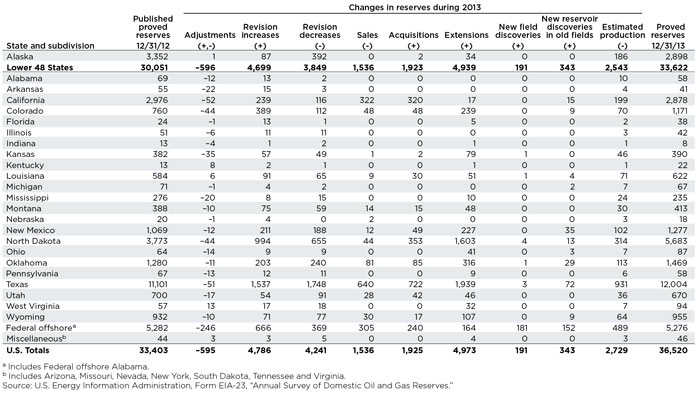
Crude/condensate reserves. Proved reserves of crude oil and lease condensate rose 3.1 Bbbl in 2013, due to an added 5.0-Bbbl extension to existing fields, and to a much lesser notion, net revisions. The majority of oil reserves have been added by extensions to existing fields, namely in each of the country’s five largest producing areas (Texas, federal Gulf of Mexico, Alaska, California and North Dakota). Proved condensate reserves increased 10% in 2013, to 3.1 Bbbl.
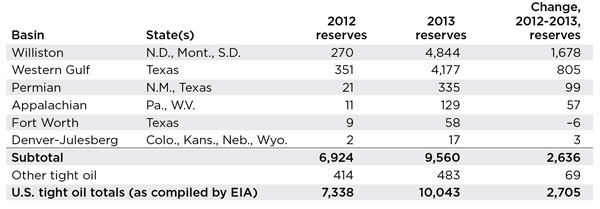
Tight oil. The EIA broke down its estimates for tight oil. As of Dec. 31, 2013, tight oil plays accounted for 28% of all U.S. crude oil and condensate reserves, and the gain in reserves from tight oil formations led to a 37% year-to-year jump, from 7.3 Bbbl in 2012, to 10.0 Bbbl in 2013. North Dakota’s reserves surpassed those of the federal Gulf of Mexico, placing it second only to Texas.
More than 95% of the additions to tight oil reserves are from the top six tight oil basins, and the primary plays within them: Williston basin (Bakken and Three Forks), Western Gulf (Eagle Ford), Permian (Bonespring, Wolfcamp), Appalachain (Marcellus), Fort Worth (Barnett), and Denver-Julesberg (Niobrara). Among those formations, the Williston basin achieved a 53% increase in proved reserves from 2012 to 2013, surging 1.7 Bbbl to 4.8 Bbbl.
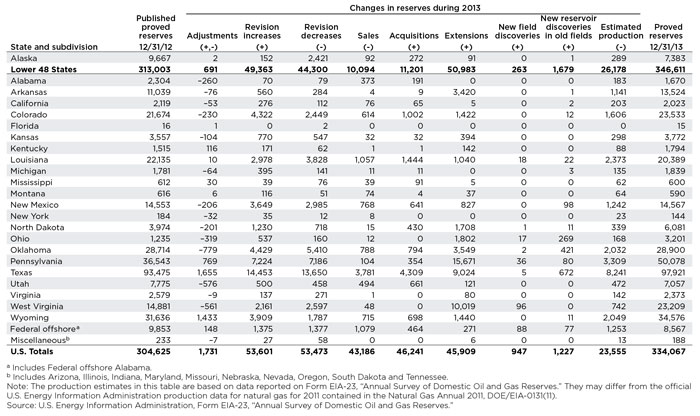
Natural gas reserves. Proved reserves of natural gas increased 10%, to 31.3 Tcf in 2013, and reached a record high of 354 Tcf. The reserves were added onshore, in the Lower 48 states, from the nation’s primary shale gas plays: the Barnett, Haynesville, Marcellus, Woodford and Eagle Ford. Broken down by state, Pennsylvania and West Virginia reported the largest net increases, up 13.5 and 8.3 Tcf, respectively. Texas added 4.3 Tcf, Wyoming increased 2.9 Tcf, and Arkansas and North Dakota each added over 2 Tcf.
Shale gas. The EIA also broke down its natural gas numbers into those formations produced from unconventional plays, with six plays containing 94% of shale gas proved reserves. These plays included the Marcellus, Barnett, Eagle Ford, Haynesville/Bossier, Woodford and Fayetteville shales. ![]()

- What's new in production (February 2024)
- Prices and governmental policies combine to stymie Canadian upstream growth (February 2024)
- U.S. operators reduce activity as crude prices plunge (February 2024)
- U.S. producing gas wells increase despite low prices (February 2024)
- U.S. drilling: More of the same expected (February 2024)
- U.S. oil and natural gas production hits record highs (February 2024)

