 |
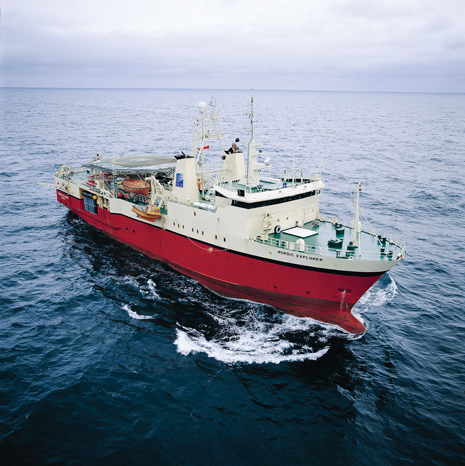
| Controlled source electromagnetic (CSEM) data for the integration exercise were acquired by the PGS Nordic Explorer over the Maureen and Heimdal reservoirs at Mariner field. |
|
The benefit of deriving resistivity values from towed-streamer EM data, integrated with seismic and well log data, was demonstrated recently by providing an estimate of the total hydrocarbon volume in a vertical section through the two reservoirs: Maureen and Heimdal in the North Sea’s Mariner complex.
A high-resistivity structure, within a large volume, was estimated from anisotropic 3D inversion. The inversion was used to extract an effective anomaly, including both reservoirs, with vertical and horizontal resistivities of 8–10 Ω-m and 4–5 Ω-m, respectively. These resistivities were then used to calculate the sand resistivities and sand grain fractions as a function of net-to-gross (N/G) and the pure shale resistivities.
The N/G is estimated from Vp/Vs and acoustic impedance obtained from pre-stack inversion of the seismic data. The shale resistivities are obtained from well log data. The hydrocarbon volume in the vertical slice of the reservoir area is then computed as the sum over the sand grain sizes, provided that porosities and hydrocarbon saturations can be estimated. In this proof-of-concept demonstration, the hydrocarbon volume was calculated to be 0.18 times the volume of the vertical section.
INTEGRATED WORKFLOW
The motivation behind acquiring CSEM data is to estimate the sub-seafloor electrical resistivity structure, and add valuable information to the seismic image of the subsurface. An obvious value of the resistivity information, in conjunction with the seismic image, is the possibility of improving the geological earth model. This is useful to select optimum drilling locations within an area of interest for hydrocarbon exploration.
To get maximum value out of CSEM data, and to facilitate extraction of quantitative information of value, the CSEM data have to be integrated with 3D seismic data. An example of this is to use the subsurface resistivity information to improve the hydrocarbon volume estimate in an identified reservoir. In a sand-and-shale reservoir, the resistivity values can be used to support the estimation of N/G, i.e., the sandstone fraction within the reservoir, as well as the sand grain fractions by volume.
An integrated workflow was developed to extract resistivities from towed streamer EM data acquired over Mariner heavy oil field in the North Sea. These resistivities enabled us to estimate the hydrocarbon volume in a vertical section of the two reservoirs, Maureen and Heimdal. The workflow also relies heavily on standard petrophysical models to estimate crucial parameters that are required in the calculations.
Anisotropic 3D inversion was then carried out to determine the horizontal and vertical resistivities in the area, including the reservoirs.1, 2 In this case, the inversion covers a region of 36 × 12 × 2.8 km, with approximately 9.7 million cells in the grid. This means the grid fully contains the entire sensitivity volume for all data acquired along the 10 survey lines. This is a huge improvement in our ability to correctly estimate the entire resistivity structure, compared to the 3D inversion performed on a small grid just enclosing the reservoirs.3
TOWED STREAMER EM SYSTEM
Figure 1 shows the main features of the towed streamer EM acquisition configuration for the Mariner survey. An 800-m long, bi-pole electric current source was towed at a depth of 10 m. The source generated 1,500 A, and the transmitted signal is the PGS Optimized Repeated Sequence (ORS).4 In this case, a discrete set of frequencies, ranging from 0.2 Hz to 1.2 Hz, with a step of 0.2 Hz was used. The source sequence was 120 s long (one shot), with the source active during the first 100 s, followed by 20 s of silence. The silent periods were then used for background noise estimation and noise reduction processing.
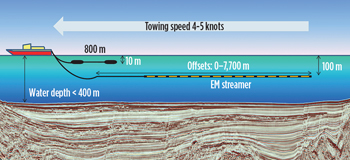 |
| Fig. 1. The geometry and towing configuration at the Mariner survey. The data are acquired at 4–5 knots. |
|
The resulting electric field in the seawater was measured along the streamer as electric potential differences in distributed electrode pairs, with offsets from 500 m to 7,700 m. In total, 72 electrode pairs of variable length, from 200 m at the front of the streamer to 1,100 m at the end of the streamer, were used in the configuration.5
MARINER FIELD
Mariner field is on the East Shetland platform of the UK North Sea, approximately 150 km east of the Shetland Isles. It consists of two shallow reservoirs: the Maureen formation and the Heimdal sandstones of the Lista formation, with nearly 2 Bbbl of oil-in-place and expected recoverable reserves of more than 250 MMbbl of oil. Both formations yield heavy oil of around 12° to 14°API.
Seismic and well log data have been used to map the horizons of a chalk layer on top of basement, as well as the horizons for the sandstones of the Maureen and Heimdal reservoirs. The resistive chalk layer varies in depth below sea surface from 1,400 to 1,500 m, with the basement underneath. The Maureen reservoir is on top of the chalk, whereas the Heimdal reservoir is about 200 m above the Maureen reservoir. The bathymetry in the region varies between 95 m and 115 m, with a relatively homogeneous overburden.
SURVEY LAYOUT
The towed streamer EM survey consists of 10 parallel lines separated by 500 m, Fig. 2. The length of each line was about 15 km. Each line recorded 60 shots of 120 s lengths. The frequency responses used in the 3D anisotropic inversion were estimated for all shots and offsets along the survey lines.4
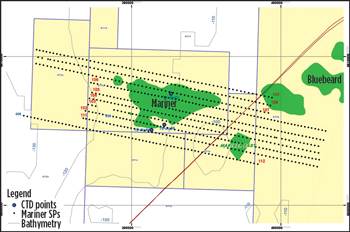 |
| Fig. 2. A map of the Mariner area showing the survey lines and corresponding shot points. |
|
ANISOTROPIC 3D INVERSION
The 3D resistivity structure is estimated by minimizing a Tikhonov parametric functional with respect to the horizontal and vertical horizontal conductivity change from a background model. The functional is expressed as:
 (1) (1)
where d and A are the measured and modelled electric field data, respectively. The matrix A is the nonlinear forward modelling operator. The regularization parameter α is updated in each iteration, according to:
 (2) (2)
In this case, the stabilizing functional is chosen as the minimum L2-norm of the difference between the current model and an a-priori model.1, 2 The optimal step length, q, and a 1D horizontally layered background model are determined from one-line anisotropic 3D inversions, without any a-priori model (unconstrained inversion). The final horizontal and vertical resistivity structures are then estimated by running the 3D anisotropic inversion on all lines at the same time, now with an a-priori model in the stabilizer functional determined from the structure defined by the available seismic data in the survey area. The a-priori model will guide the inversion result toward a more reasonable geophysical model.
The final result with an rms misfit value of 6.4% after 40 iterations is shown in Fig. 3. It can be seen that a high-resistivity anomaly, with vertical resistivity of 8–10 Ω-m and horizontal resistivity of 4–5 Ω-m, is showing up in yellow and green colors on top of a high-resistivity chalk/basement underburden in red, with more or less isotropic resistivity up to 30 Ω-m. The resistive anomaly appears right on top of the chalk, which corresponds well with the Maureen depth. The anomaly also coincides well with the horizontal extent of both the Heimdal and Maureen reservoirs, even though this information has not been used as a constraint in the inversion. Unfortunately, the inversion has not been able to separate the anomaly into two individual volumes, corresponding to the vertical separation of the two reservoirs. For visualization purposes, the resistivities below 5 Ω-m have been removed.
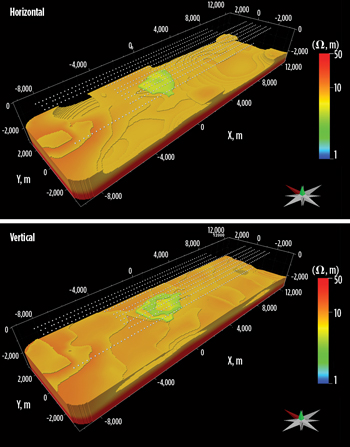 |
| Fig. 3. The 3D resistivity cubes after inversion. |
|
The inversion domain was selected to cover all sensitive parts of the subsurface. The dimensions were: X: from -18,000 m to 18,000 m; Y: from -6,000 m to 6,000 m; and Z: from 200 m to 3,000 m (positive downward). This rectangular region was discretized into cells of size 50 m x 50 m x 50 m. The selected data for the inversion consisted of 323 shots with 18 offsets (1,750–6,700 m) and five frequencies (0.2, 0.4, 0.6, 0.8, and 1.0 Hz). The run time, on a PC cluster with 10 cluster nodes, using 2.2 GHz Xenon Westmere processors running 4 OpenMP threads each, was 7 hr.
HYDROCARBON VOLUME
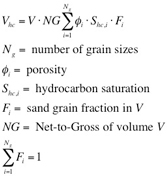
To calculate the hydrocarbon volume, it is assumed that the vertical slice through the Heimdal and Maureen reservoirs under consideration is built of a layered stack of shale and sand, according to the selected volume V in Fig. 4. The hydrocarbon volume in V can then be expressed as:
 (3) (3)
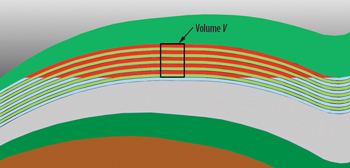 |
| Fig. 4. Shale and sand layering constituting the N/G assumption of the reservoir region. |
|
This is basically a summation over the fractions of the various sand grain sizes that constitute the sand in average. The porosity of the sands and the N/G values are estimated from pre-stack inverted seismic data within the reservoir. The hydrocarbon saturation for each grain size depends on the irreducible water saturation, which is the ratio between the Buckle’s number and the porosity.6 The Buckle’s number is unique for each grain size. In this particular case, the sand is found to be composed of discrete beds, with the grain sizes ranging from very fine, fine and medium, having the Buckle’s numbers 0.12, 0.06 and 0.03, respectively. The corresponding hydrocarbon saturations then become 0.6, 0.8 and 0.9. In this proof-of-concept case, we further assume that the porosity is 0.3 for all the grain sizes.
The next step is to determine the fractions in the summation (3). This is done by calculating the effective horizontal and vertical resistivities of the sand, given the resistivities from the CSEM inversion, and appropriate horizontal and vertical resistivity values of the shale. The sand may effectively behave as an anisotropic media, because of the various grain sizes with different bulk resistivities.
Ideally, the shale resistivities are obtained from well logs, but could also be inverted from the CSEM data. In this case, the horizontal shale resistivity is determined from a well log to 1.5 Ω-m. The average anisotropy in the shale overburden is about 1.66. Hence, a vertical shale resistivity of 2.5 Ω-m is suitable for use in volume V.
The horizontal sand resistivity is now obtained from the equivalent equation of parallel resistors in volume V and the vertical sand resistivity from the equation governing resistors in series. The result, as a function of N/G, is plotted in Fig. 5. It is then possible to uniquely calculate the sand grain fractions from the corresponding parallel resistors and resistors in series equations given the effective hydrocarbon charged sand resistivities, and the intrinsic grain size dependent resistivities from Archie’s equation and the constraint that the sum of the fractions is equals to one.7 In this case, with three grain sizes, the fractions as function of the N/G are plotted in Fig. 6.
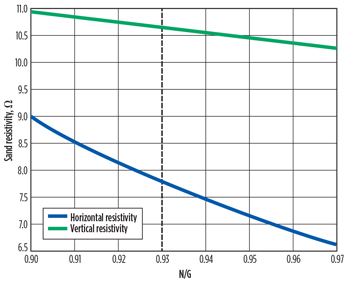 |
| Fig. 5. The horizontal (blue) and vertical (green) sand resistivities as a function of N/G. |
|
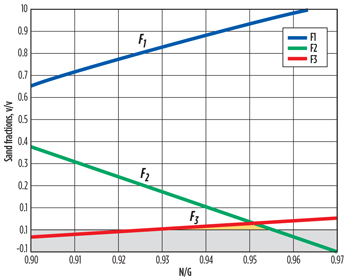 |
| Fig. 6. Various fractions as a function of N/G. |
|
Physically relevant fractions have to be positive. Hence, the available fractions are then found in the N/G range from 0.930 to 0.955. The physically consistent N/G value can be further fine-tuned within this range by means of the pre-stack inverted 3D seismic data. Pre-stack inverted data are typically evaluated as a cross-plot between acoustic impedance (AI) and Vp/Vs, as suggested in Fig. 7.
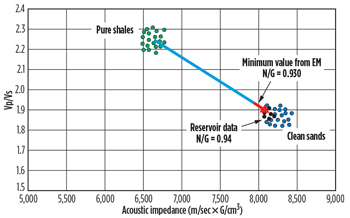 |
| Fig. 7. The N/G can be calibrated in a cross-plot of AI and Vp/Vs from the pre-stack inverted seismic data. The N/G is found to be 0.94. |
|
From this cross-plot, the N/G value is found to be 0.94. The sand fractions are then F1: 0.88 (very fine grained); F2: 0.10 (fine grained); and F3: 0.02 (medium grained). This means that all quantities in equation (3) are known, and the amount of hydrocarbon fraction in the volume V can be calculated to be 0.18.
CONCLUSIONS
The towed streamer EM system acquires data at the same speed as 2D seismic is acquired (4–5 knots). For the first time, it is possible to acquire marine CSEM data efficiently and cost-effectively. The dense data acquired from a set of parallel survey lines over an area of interest can be used in a 3D anisotropic inversion algorithm to estimate the horizontal and vertical resistivities in a 3D grid covering the subsurface volume, where the EM data sensitivity is sufficient.
Conceptually, it can be shown that these resistivity values can be used, together with seismic and well log data, to estimate the total hydrocarbon fraction in a reservoir volume. In particular, it is possible to calculate the effective sandstone resistivities, and also the fractions of different sand grain sizes as a function of the N/G of the sand and shale quotient in the reservoir. Together with the porosity and the N/G value obtained from pre-stack inverted 3D seismic data, the hydrocarbon volume fraction can be calculated by adding the contributions from the computed sand grain fractions. The result is a model that is consistent with all the observed data. Nevertheless, this method is expected to provide a very good estimate of the total hydrocarbon volume in place, and the result is only limited by the uncertainties in the input data. 
ACKNOWLEDGEMENTS
Thanks to Petroleum Geo-Services (PGS) for the right to present the results of this towed streamer EM Mariner survey, and TechnoImaging for support of the research and permission to publish.
REFERENCES
- Zhdanov, M. S., M. Endo, L. H. Cox, M. Cuma, J. Linfoot, C. Anderson, N. Black and A. V. Gribenko, 2014a, “3D inversion of towed streamer electromagnetic data,” Geophysical Prospecting, doi: 10.1111/1365-2478.12097.
- Zhdanov, M. S., M. Endo, D. Yoon, J. Mattsson and J. Midgley, 2014b, “Anisotropic 3D inversion of towed streamer EM data: Case study from the Troll West oil province,” Journal of Interpretation, Vol. 2, No. 3 (August 2014); pp 1–17.
- Mattsson, J., J. Skogman, A. Bhuiyan, A. McKay and C. Anderson, “3D inversion results from towed streamer EM data in a complex geological setting,” World Oil, Vol. 234, No. 9, 2013a.
- Mattsson, J., P. Lindqvist, R. Juhasz and E. Björnemo, “Noise reduction and error analysis for a towed EM system,” 82nd SEG Conference & Exhibition, Extended Abstracts, 2012.
- Mattsson J., F. Engelmark and C. Anderson, 2013b, “Towed streamer EM: The challenges of sensitivity and anisotropy,” First Break, Vol. 31, 6, pp 155–159.
- Buckles, R. S., 1965, “Correlating and averaging connate water saturation data,” Vol. 9, No.1, pp 42–52.
- Archie, G.E., 1942, “The electrical resistivity log as an aid in determining some reservoir characteristics,” AIME Petroleum Transactions, No. 146, pp 54–62.
|


 (3)
(3)


