SRINIVASA KONETI, JOHN ROSS and SAMIT GOKHALE, T H Hill Associates
 |
|
Testing of OCTG components requires careful attention to specimen selection, to avoid possible brittle cracking. The specimen should be taken from either a sacrificial production part, a prolongation removed from a production part, or from a Quality Test Coupon (QTC) from the same heat, that is correctly sized.
|
|
Brittle cracking of oilfield tubular components can occur, due to poor fracture toughness of the material. For heat-treated material, most vendor and user manufacturing specifications, including those from the American Petroleum Institute (API), require the mechanical test specimen to be removed from either a sacrificial production part, a prolongation removed from a production part, or a QTC from the same heat. In certain cases, manufacturers prefer to perform all mechanical testing on a QTC. Improper testing methods used after manufacturing, including improper QTC testing, may lead to catastrophic, brittle failures.
This article presents case studies, which show that the material test results obtained on the QTC, especially Charpy V-notch (CVN) impact energy values (pointing to the fracture toughness of the material), varied significantly from the material properties of the actual component. If the testing had more accurately reflected the material properties of the actual component, it would not have been put in service and would not have failed. The article also discusses the testing locations on larger-diameter components, apart from appropriate, representative testing methods. The mechanical properties of larger-OD components vary significantly from the OD to the ID of the component. The article provides procedures for testing at appropriate locations to get the actual mechanical properties at critical sections in the finished component.
CASE STUDIES
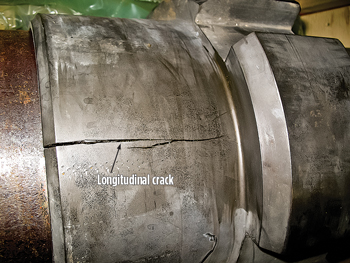
Case 1 (C1) is a mandrel hanger failure. It was reported that the string was picked up, after making up the mandrel hanger and pup joint with the casing running tool. When the string weight was on the mandrel hanger tool, a loud sound was heard. Lifting was stopped, and the casing was examined, where it was observed that a huge longitudinal crack had formed on the mandrel hanger box connection, Fig 1. The failed mandrel hanger was sent to T H Hill Associates (THHA) to determine the root cause of the failure.
 |
|
Fig. 1. Overall view of the C1 longitudinal crack.
|
|
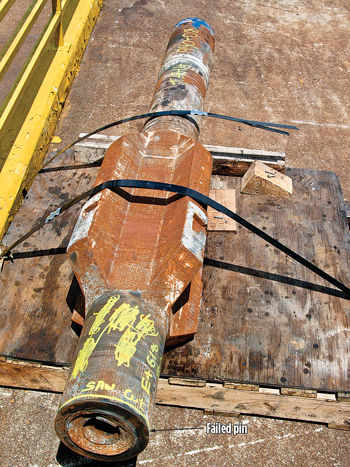
Case 2 (C2) is a BOP wear bushing running tool failure. The pin connection of the tool twisted-off, while making up with the drill collar box connection. Based on a visual examination of the fracture surface, the failure mechanism was identified as a brittle fracture with rapid crack propagation, Fig. 2. To confirm the cause of the failure, the failed wear bushing running tool was sent to THHA for further investigation.
 |
|
Fig. 2. Overall view of the C2 pin failure.
|
|
 |
|
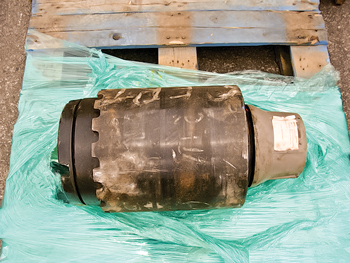
Fig. 3. Saver sub (C3) as received for testing.
|
|
Case 3 (C3) is a saver sub, which had no physical failure. A review of material test reports was requested by an operator for a 12-in. OD top drive saver sub (NC77 box x 6⅝ FH pin) as part of a fit-for-purpose evaluation associated with a deepwater landing string analysis. The material testing was performed at 1 in. below the OD of the bar stock, which was not the critical section of the saver sub. A representative saver sub was sent to THHA, to determine the material properties at the critical section of the saver sub, Fig. 3.
Visual examination
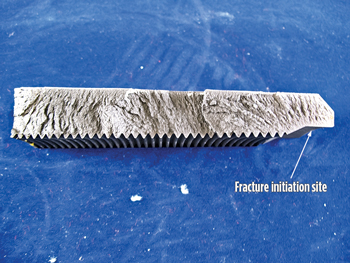
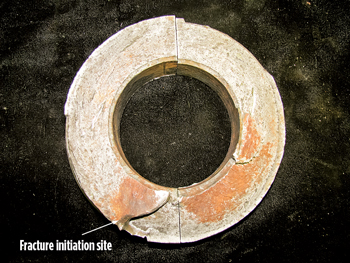
The C1 and C2 fracture surfaces were examined visually to identify signatures on the fracture surface to help determine the fracture mechanism. The overall appearance of the fracture surfaces was flat and exhibited a grainy texture, Figs. 4 and 5. This is typical morphology for brittle cracking.
 |
|
Fig. 4. Overall view of the fracture surface on C1.
|
|
 |
|
Fig. 5. Overall view of the C2 fracture surface.
|
|
SEM analysis
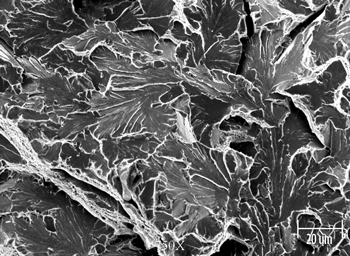
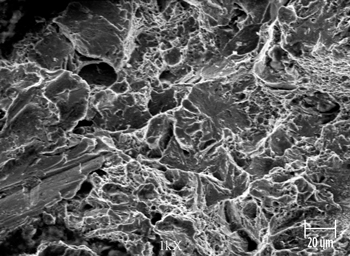
The C1 and C2 fracture surfaces were observed, using a scanning electron microscope (SEM). The fracture examination revealed transgranular features (Figs. 6 and 7), which are typical of a brittle fracture. This examination confirmed that the failures were caused by brittle cracking.
 |
|
Fig. 6. C1 fracture surface, as seen under SEM.
|
|
 |
|
Fig. 7. C2 fracture surface, as seen under SEM.
|
|
Material testing
Material testing was performed on the C1 and C2, to compare the tested results with Material Test Reports (MTRs) and to determine if poor material properties contributed to failures. Material testing was also performed in the critical section and 1 in. below the surface of the top drive saver sub (C3). Tables 1 and 2 present the test results obtained on the components. The material properties obtained on the failed mandrel hanger, wear bushing running tool and the saver sub (obtained at the critical section) varied significantly from those listed in the MTR.
| Table 1. Material properties obtained on C1 and C2. |
|

|
| Table 2. Material properties obtained on C3. |
|

|
C1: Mandrel hanger. Upon review of the MTR, THHA determined that the mandrel hanger was machined from a heat-treated raw bar of 14.23-in. diameter by 160-in. length. A QTC of 4-in. H x 4-in. W x 8-in. L size (meeting PSL 3 and PSL 4 requirements from API Spec. 6A) was also heat-treated, along with the raw bar, to represent the material properties of the raw bar. All the material testing was performed on the QTC, instead of the raw bar. The variation in properties between QTC and hanger can be attributed to the difference in the thickness of the raw bar to the thickness of the QTC. The Charpy results obtained on the failed sample were very low and also showed a huge variation from the MTR values. Impact toughness correlates well with fracture toughness of the steel. Low-fracture toughness makes the material notch sensitive and typically results in a predominately brittle fracture [Hill, T.H.: Drill String Design and Failure Prevention], as was seen in the failure itself.
C2: Wear bushing running tool. Similar to C1, the wear bushing running tool was machined from a heat-treated raw bar of 18-in. diameter. Along with the raw bar, a QTC of size 4-in. H x 4-in. W x 6-in. L (which meets PSL 3 and PSL 4 requirements from API Spec. 6A) was also heat-treated to reflect the material properties of the raw bar. The material testing results, obtained on the QTC, varied significantly from the mechanical testing results obtained on the failed component. This variation in mechanical properties can be attributed to the difference in the thickness of the raw bar (18-in. diameter) to the thickness of the QTC (4-in.).
 |
|
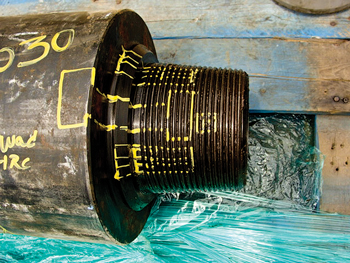
Fig. 8. Saver sub 6⅝ FH pin and body size.
|
|
C3: Top drive saver sub. For the sub, Fig. 8 shows the pin size relative to the body. The sub had a 12-in. OD with a 4-in. ID. Mechanical testing was performed at 1 in. below the body surface and at the critical section (near pin neck) of the saver sub to evaluate the sub’s properties against API Specification 7-1 material testing requirements, and to compare against MTR values, Table 2.
The results obtained from 1 in. below the surface met API Specification 7-1 for strength and Charpy V-notch Impact Energy (CVN). However, the Charpy impact values obtained near the pin neck critical section did not meet the minimum CVN requirements. The reason for the low CVN values is likely associated with the difficulty of heat treating large-diameter, frequently solid bar stock.
The critical section was found to have significantly low CVN values, which are indicative of brittle material that is sensitive to cracking. This means that typical crack detection inspection intervals may likely be too long to find the cracking prior to failure. Further, failure of this type of component can be very dangerous, as it is overhead in the top drive section and sees the highest loads in the string.
QTC SELECTION
Equivalent Round (ER) methods, as specified in API Specification 6A (twentieth edition) section 5.7.2 and API Specification 7-1, Annex C, C.5.3.1, are used to determine the size of a QTC. The ER of a part is determined using the actual dimensions of the part in the “as heat-treated” condition. The ER of the QTC must be equal to, or greater than, the ER of the part it qualifies, except as follows (API Spec. 6A):
For Product Specification Level (PSL) 2:
Forging: size not required to exceed 2½ in. ER
Casting: size not required to exceed size shown in ASTM A703/A703M
For PSL 3 and PSL 4: size not required to exceed 5 in. ER.
API 7-1, Annex C has no QTC requirements for PSL 2, and above, for drilling components. In several cases, manufacturers prefer to select the QTC size, based on PSL 3 and 4 requirements from specification 6A, which are intended to be more stringent for wellhead components. However, the limited ER is only meant to apply to wellhead and Christmas tree equipment (the scope of 6A). If ER methods are used on drilling components, there is no reason to limit the ER value at all.
CONCLUSIONS
Improper test methods used after component manufacture, such as QTC testing, may lead to catastrophic brittle failures during service. Material testing should be performed on test specimens that are taken from either a sacrificial production part, a prolongation removed from a production part, or from a QTC from the same heat that is correctly sized.
In some cases, the manufacturers prefer to perform all mechanical testing on a QTC, instead of an actual heat-treated raw bar. However, case studies C1 and C2 indicate that material test results obtained on the QTC, especially Charpy V-notch impact energy values, which point to the fracture toughness of the material, often do not accurately represent the material properties of the actual component. Using prolongations or sacrificial components are preferred, since they tend to more accurately represent the machined component material properties. Even following the QTC requirements to API 7-1, Annex C will more accurately represent the actual raw bar properties as API 7-1, Annex C has no limits on QTC requirements.
C3 showed that the testing performed at 1 in. below the surface is also not desired for large-diameter bar stock that has smaller critical sections. Additional testing at mid-wall should be performed to evaluate the critical section of the component. The best way to evaluate the material properties is to perform the testing at the critical section (near pin neck). 
ACKNOWLEDGMENT
This article is adapted from IADC/SPE paper 163441, presented at the IADC/SPE Drilling Conference, held in Amsterdam, March 5-7, 2013.
REFERENCES
1. API Specification 6A, Specification for wellhead and Christmas tree equipment, 20th edition, American Petroleum Institute, October 2010, Section 5.7, p. 47.
2. API Specification 7-1, Specification for rotary drill stem elements, 1st edition, American Petroleum Institute, March 2006, Table A.17, p. 61.
3. Hill, T.H., Drill string design and failure prevention, T H Hill Associates, Inc., September 2002.
4. American Society for Metals, “Failure analysis and prevention,” Metals Handbook, Vol. 11, November 1986, p. 11.
5. American Society for Metals, “Fractography,” Metals handbook, Vol. 12, 9th edition, March 1987, p. 13.
|
The authors
SRINIVASA KONETI is a senior failure analyst and materials engineer at T H Hill Associates. He has been with the company since 2008 and has worked on numerous failure analysis projects for major and independent operators in oil and gas regions of the world. He also manages the failure analysis and materials engineering consulting work by delegating and overseeing the projects. He holds an MS degree in material science engineering from Florida International University.
JOHN ROSS has been a drilling and completion project consultant at T H Hill Associates since 2008. He has provided engineering support for an array of projects, including deepwater landing string analysis, failure investigation, mechanical design review and drill string design. He holds a BS degree in both mechanical engineering and aerospace engineering from the University of Florida.
SAMIT GOKHALE, vice-president of engineering at T H Hill Associates, has been with the company since 2001. He manages all engineering projects and is an instructor for drillstring design and failure prevention courses. He also provides expert witness support for investigations that lead to litigation. He holds a MS degree in mechanical engineering from the University of Florida.
|
|


