Leonard Parent, Contributing Editor
If you’re in the gas marketing end of the natural gas business, 2008 was an experience unlike any other, watching gas prices follow oil prices into the stratosphere and then crash back to where they had been.
Shale, coalbed methane and other unconventional gas plays continued to supply about 40% of total US gas production. Advances in horizontal drilling and fracturing technology made it possible by substantially increasing productivity per well. Meanwhile, bottlenecks are being resolved by pipeline expansions that are well underway to move coalbed methane and shale gas from developing sources, with more pipeline capacity yet to come.
The LNG option has added to the supply side of the equation, and it came on the scene at a good time. Inasmuch as LNG is a global commodity, the price is determined by the world market and not by US buyers. This adds another dimension to the gas price basket.
Elsewhere, Gulf of Mexico supply is a growing concern, deliverability from existing reserves is declining, and reserve additions are not keeping up. Gas deliveries from Canada are past their peak and gas from Alaska is still far down the road as rival pipeline plans vie for the chance to deliver the state’s gas reserves to the Lower 48.
Last year, exploration was on a binge. The rig count made another peak. That helped, but now it’s history. Everyone got with the program and hooked up enough new gas to fill in the blanks. It was fun while it lasted, but the party’s over, at least for the time being. Of course, if and when demand begins to grow again, that could be a different story.
Adding up the pluses and minuses of the supply side picture, things could be a lot worse.
Looking back over the history books, it turns out that consumption (essentially, the same as demand) has been virtually flat since the major interstate pipelines got hooked up from coast to coast and from border to border, back around the early 1970s. (See the US marketed gas production graph on p. 67.)
SUPPLY SIDE
The key word in 2008 was productivity. Gas-directed drilling set new records, gas well completions were strong, LNG cargoes were landing, but activity in conventional gas supply was not coming up with the deliverability to replace what was being produced. Overland imports from Canada fell back. LNG helped bridge the gap until something better came along. And come along it did.
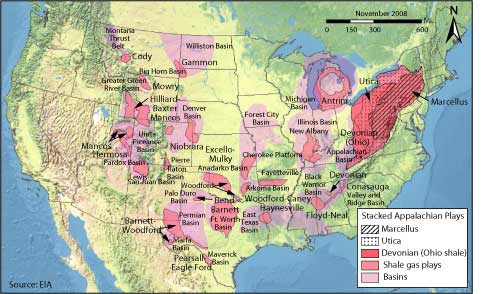
Well, it turned out a little different from expectations. Productivity from shale hit the ground running, with more to come this year. It turns out that there’s a whole lot of gas under our feet, so to speak (Fig. 1); proved reserves of US shale gas jumped 50% in 2007 to about 21 Tcf, about 9% of US proved gas reserves, according to the US Energy Information Administration (EIA). Producers knew it was there for a long time, but didn’t much care because of low productivity.
 |
|
Fig. 1. US shale gas plays.
|
|
But advances in horizontal drilling and fracturing technology made it possible to increase productivity from shale, coalbeds and tight sand wells, putting a little light at the end of the supply tunnel at a time when it was really needed.
Coalbed methane drilling has plateaued over the past two years after a long upward advance, but production is still rising steadily. There is a lot of gas in the coalbeds of the Rockies, but developing the pipeline infrastructure to get it to market has been challenging, and this has held down activity.
Meanwhile, the Gulf of Mexico needs some spectacular discoveries such as the Independence Hub to justify the enormous cost of development in deep water, and that cost will take some technological breakthroughs to bring down. Independence Hub came onstream in 2007 and has ramped up ever since, producing nearly 1 Bcf a day last year.
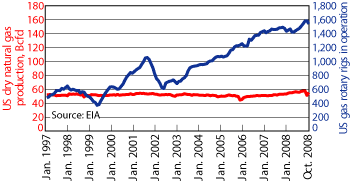
All in all, Lower 48 reserves have increased substantially in recent years, while deliverability has not. Due to the popularity of shale drilling and the anemic production associated with shale gas, average well deliverability is down to a mere fraction of what it has been in years past. In a manner of speaking, gas producers are having to run faster just to stay in place. That is, they have to drill more than twice as many wells just to keep production flat; and there seems to be no end in sight, Fig. 2. This bodes well for avoiding a large downward turn in gas drilling, as activity cannot decrease for any period of time without causing a steep production shortfall.
 |
|
Fig. 2. US gas rotary rigs in operation vs. dry gas production, 1997 to present.
|
|
Equally important, this bodes well for prices. Depending on the geology of the particular play, most analysts put the break-even price of these plays in the $5.50 - $8.00 range, which is well above today’s prices of $4.50, which is not a sustainable price. Thus, expect any downturn to be short lived.
In the months ahead, the drilling of more horizontal wells, with more productivity per well, will help to offset some of the expected decline in the number of gas wells drilled. As always, demand and activity will also depend largely on winter weather.
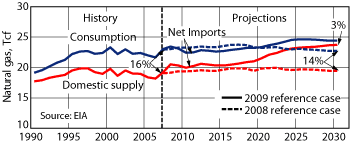
Looking further down the road, the EIA released a startling prediction in its early draft of its Annual Energy Outlook 2009: US gas production, largely from unconventional sources, will outpace demand during the next two decades, and gas imports will fall to near zero by 2030, Fig. 3. In fact, with regard to pipeline gas trade, the EIA reference (most likely) case has the US becoming a net exporter. This is a big change from the 2008 report, which saw US gas imports staying relatively flat at 14% through 2030. And it’s great news for US gas producers-if it plays out. But remember, these long-term forecasts are often made based on the slimmest of trends, as this one appears to be, and are often replaced with ones that look quite different the next year. A wait-and-see attitude seems to be the most appropriate one to adopt here.
 |
|
Fig. 3. US gas supply vs. consumption forecast to 2030.
|
|
PRICES
It was quite a ride. The monthly average wellhead price of gas started the year at just under $7/Mcf, just when things were starting to get interesting, but it wasn’t until July that the gas price index peaked at $12.25. Putting it into a longer perspective, the index made a floor at $5.48 in January 2007, then again at $5.32 in August 2007, and now again in November 2008 at $5.46. No matter how high it goes, the price seems to come back to this range.
Remember, prices vary significantly between what buyers pay coalbed methane operators in Wyoming and the price for offshore gas in the Gulf of Mexico, and at all points in between. As best we can tell, the price of oil was the lead dog in this hunt-the run-up of gas prices. When the price of oil rocketed up to $140, gas had to follow but couldn’t maintain the pace, although it did double at one point. It was not quite the same as the spread between $40 and $140 oil, but a large jump nonetheless.
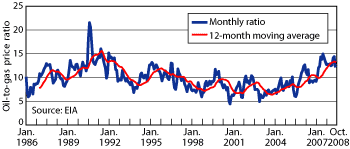
The golden oil-to-gas price ratio of about 6.0 - 6.5 (in dollars per barrel of crude oil to dollars per Mcf of gas), hasn’t held since at least 1986, and no new benchmark ratio seems to have taken hold since then. This, despite the fact that around $6.44/Btu is the equivalent price in energy terms between oil and gas. However, graphing the ratio of West Texas Intermediate over US average wellhead gas prices on a monthly basis (Fig. 4) yields a plot that looks more like an hourly stock price chart than anything else. Apparently, there are just so few industries that are able to fuel switch that the energy-equivalent price has very little effect.
 |
|
Fig. 4. Monthly oil-to-gas price ratio (using WTI crude and US average wellhead gas prices), 1986 to present.
|
|
If the players resist the lure of an unconventional boom, then stable-though not increasing-gas demand will tend to keep the average price close to where it is now.
DEMAND
The demand outlook for 2009 is not very promising. Consider that North American gas demand is mostly for heating, making it very weather-driven. Last summer, when gas and oil prices spiked, gasoline consumption dropped. Now that the height of the heating season is here, high-priced gas bought last summer is coming out of storage and reaching users’ meters.
The decision of whether to heat one’s home isn’t as price-dependent as whether to take a summer road trip, but some reduction in winter gas usage is inevitable. However, the burner tip end of the business isn’t immune to technological advances, such as combined cycle generation and improved insulation.
The economy is not in good shape. Industrial production is down, taking gas consumption along with it. The one silver lining is electric generation, a growing market for gas.
Most forecasters are saying that demand will increase. Don’t count on it. More likely demand will stay about the same as in 2008, which is the best outcome that can be expected. Down the road, the EIA Annual Energy Outlook 2009 predicts that electrical generation will drive increased US gas demand through 2030. With the new Obama administration making moves to “green” the energy sector-with coal-fired plants in its crosshairs and cap and trade on the horizon-this scenario seems likely to play out as natural gas becomes a “bridge fuel” between the old and new.
LNG
For a while last year, LNG operators were scrambling to get receiving terminals off the drawing board and in service. At present, the US has a number of receiving terminals in service, strategically located to access the New England heating market and gas-fired electric generating plants serving that same market area. Storage for LNG deliveries becomes an issue. A shipload of LNG, about 3 Tcf worth, has to be unloaded and sent to market in a hurry, a lot faster than an electric generating plant can use it.
Now that more electric generation is in play, quality makes a big difference. Power plant furnaces have pretty tight design criteria for the fuel they burn, to maximize efficiency. The problem is that the operators need to have a pretty good idea of the heating value of the gas stream coming to the plant side-gate day after day so they can make their plans accordingly. When a tanker with a load of 1,040-Btu gas unloads at an upstream gasification terminal that feeds into a pipeline with an average heating value of 1,020 Btu or so, that could impact the heating value of the gas stream going to the generating plant. It still burns, but it could fall outside the furnace design criteria.
Japan, for example, has no big-time indigenous gas supply; everything comes in as LNG. And the Japanese have recognized that not all LNG has the same heating value. They have worked out a system whereby they have split their national piping system into two parts, north and south, and LNG shipments are delivered to either system, based on the heating value as well as other criteria. Such a scheme may be worth exploring as part of future efforts to moderize the US energy supply. 
|
THE AUTHOR
|
|
|
Leonard Parent, a World Oil contributing editor, holds a BS degree in chemical engineering from Purdue University, and has been active in the gas business since 1950, beginning with Natural Gas Pipeline Co. of America. He later joined Trunkline Gas Co. in Houston and, in 1968, was appointed to corporate planning for Panhandle Eastern. Mr. Parent took early retirement after 26 years with Panhandle and Trunkline, and is publisher of The Gas Price Report and The Gas Price Index.
|
|
|


